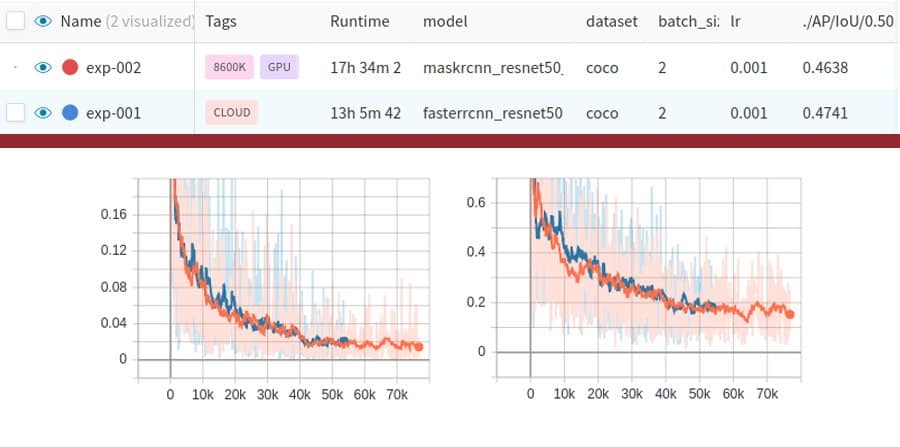
When approaching a problem using Machine Learning or Deep Learning, researchers often face a necessity of model tuning because the chosen method usually depends on various hyperparameters and used data. The common way to tackle such problems is to start with implementing a baseline solution and measuring its quality. Then, the goal is to outperform it by changing parameters like model type, optimizers, losses, batch size, learning rate and others.
Often, quite a few experiments are performed before a good solution is obtained. That’s why tracking the best hyperparameter set may become a difficult task. Many researchers use spreadsheets for logging their experiments. Unfortunately, not all changes are put on a list since they may be considered too small or irrelevant and it requires a great deal of self-discipline from a researcher not to forget tracking these changes. Remember the feeling when your best model’s checkpoint was not saved or was accidentally deleted? Not tracking hyperparameters or data changes is even worse than not saving your checkpoints. What good is a new state-of-the-art model snapshot if the way to reproduce it is lost?
In this post, we won’t describe how convolutional neural networks work or how DL-based object detection can be done. You can read about it in the previous posts, e.g. Faster R-CNN Object Detection with PyTorch.
Experiment tracking
Experiment logging tools can be split into three categories
- Cloud – code and data are stored in the cloud and experiments are run in the cloud infrastructure.
- 50/50 – code and data are stored on any machine (e.g. your local machine) while logging is in the cloud.
- In-house – code and data are stored anywhere. The logging and visualization tools are set up by the user.
In this post, we are not focusing on pure cloud solutions. Let’s concentrate on the remaining two categories and start with in-house solutions.
An ideal experiment tracking tool
- Easy to setup & run visualization front-end
- Easy to add in a project
- Logs can be easily moved to another machine or be available anywhere
- Free
- Community-supported
For me, the most obvious choice is TensorBoard as it’s open-source, widely used, supported and easy to apply in any project.
Task
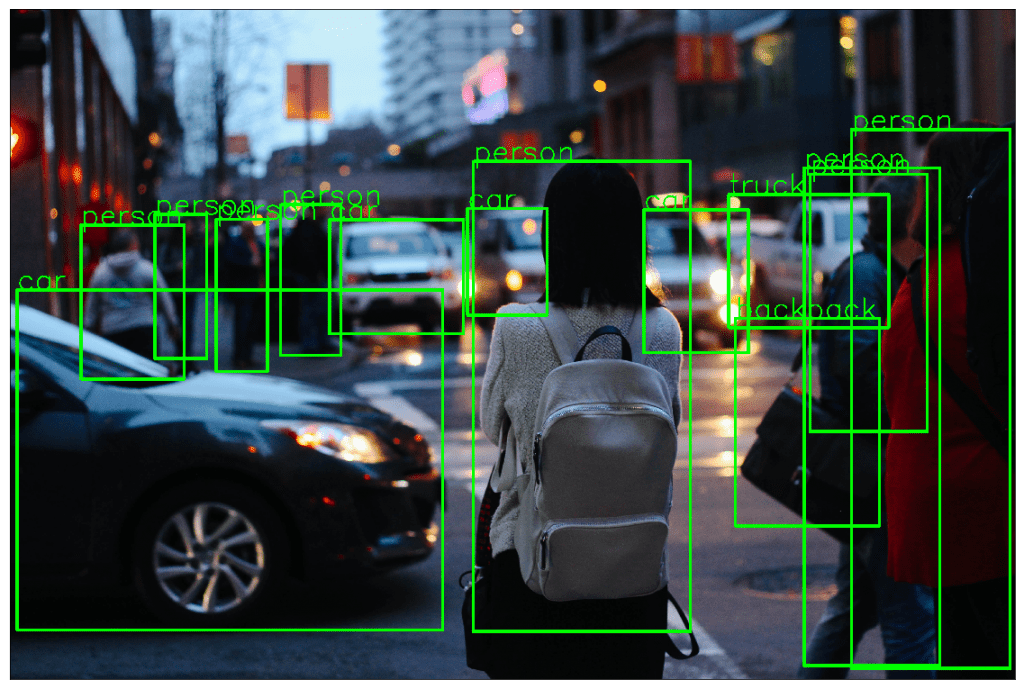
Let’s start with a real task and try to apply an experiment logging approach to the existing code. Object Detection Task on COCO dataset using Torchvision object detection models is considered in this post. We are going to use the code from torchvision as is, we won’t change anything as the idea is to show how an experiment logging functionality can be brought into some existing training framework.
First of all, we need to download COCO images and their annotations from the COCO website and unzip the data. Your folder structure should look like this:
├── coco
│   ├── annotations
|   |   ├── instances_train2017.json
|   |   ├── instances_val2017.json
│   ├── train2017
|   ├── val2017
Then, just clone the training code for the task from PyTorch Torchvision repository and install the required dependencies via pip
python3 -m pip install -r requirements.txt
The last thing is to modify --data_path flag by setting up the path to unzipped COCO data. The final running command should be
python3 train.py --data_path PATH
The training process in the original code is implemented with the distributed mode support. To avoid potential issues associated with logging from several processes, we will apply logging only in the main one by using is_main_process() function from utils.py.
# applying logging only in the main process
if utils.is_main_process():
    # code that performs logging
Now, when everything is ready, let’s start with experiment tracking using TensorBoard.
TensorBoard
“Google’s tensorflow’s tensorboard is a web server to serve visualizations of the training progress of a neural network, it visualizes scalar values, images, text, etc.; these information are saved as events in tensorflow. It’s a pity that other deep learning frameworks lack of such tool, so there are already packages letting users to log the events without tensorflow; however they only provides basic functionalities. The purpose of this package is to let researchers use a simple interface to log events within PyTorch (and then show visualization in tensorboard).” (c) tensorboardX contributors
To start with PyTorch version of TensorBoard, just install it from PyPI using the command
pip3 install tensorboardX
Then, in our project, we should initialize SummaryWriter that will log everything we want including scalars, images, hyperparameters, etc.
# experiment name
name = "exp-000"
# path where tensorboard logs will be stored
log_dir = "experiments"

# create our custom logger
logger = SummaryWriter(log_dir=osp.join(log_dir, name))
# log files will be saved in 'experiments/exp-000'
The last thing is to launch the web application to see the logs. That can be done by the following command:
tensorboard --log_dir experiements
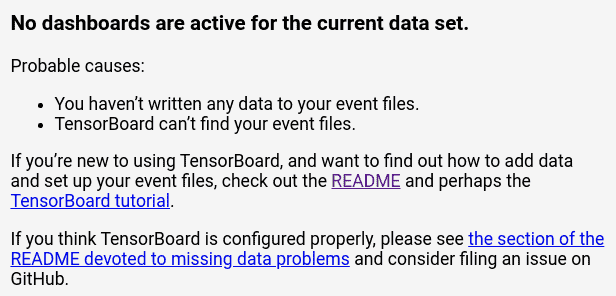
That’s it! Now we should add some actual data we want to log using the general API format logger.add_something(). There are a lot of things that TensorBoard can visualize. Here is a list of some of them:
- Add scalar
- Add image
- Add histogram
- Add figure
- Add graph
- Add audio
- Add embedding
For each DL-based task we need to have loss visualization that can be done by adding scalars. If the task is related to CV, it’s also good to have visualization of images. Finally, we always want to store the hyperparameters of each experiment. Summarizing this, we expect the logging framework to do the following in the Object Detection task:
- Keep track of the hyperparameters used in experiments
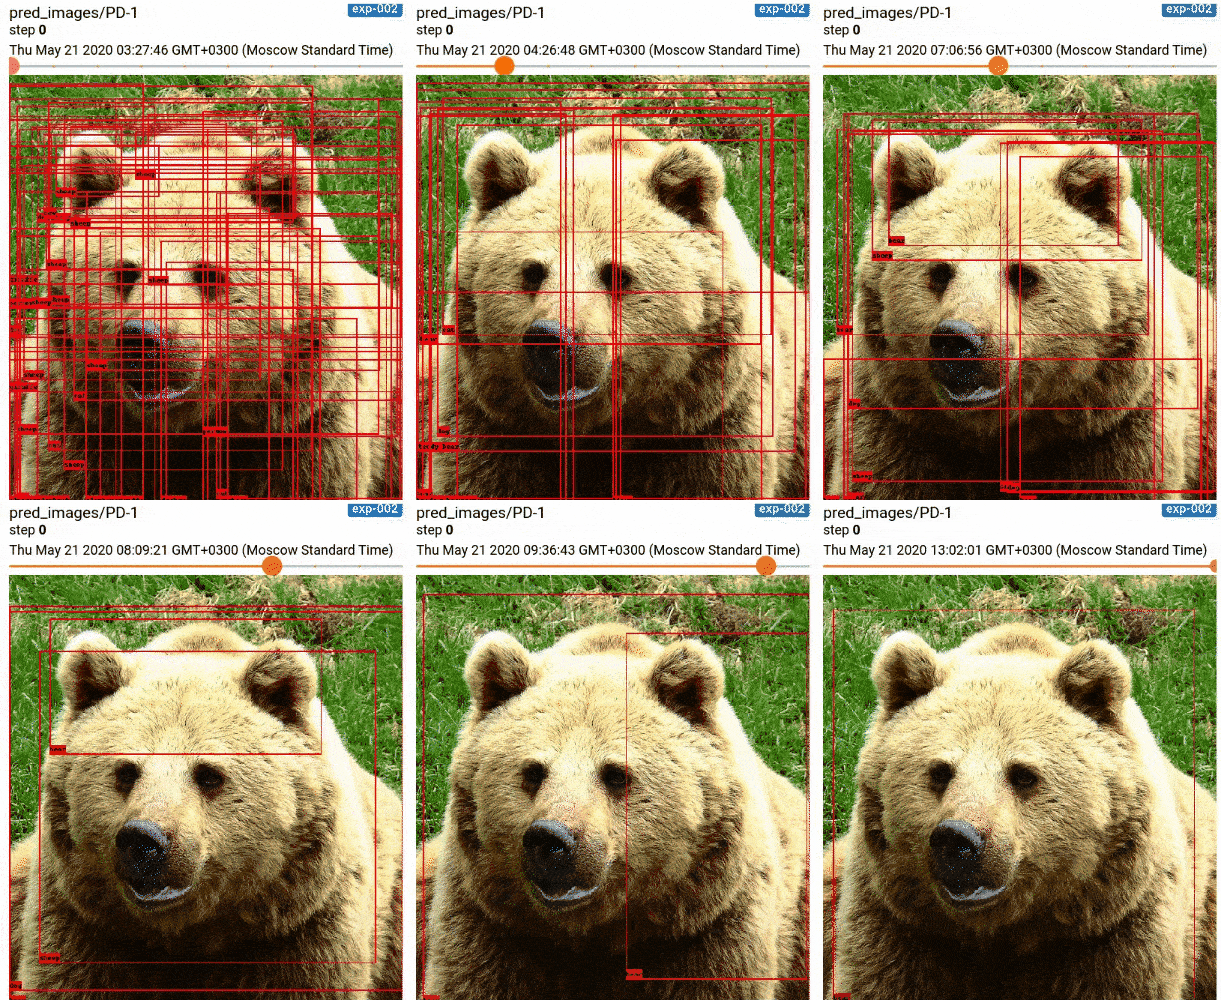
- Visualize how the predicted bounding boxes and labels are changing during training
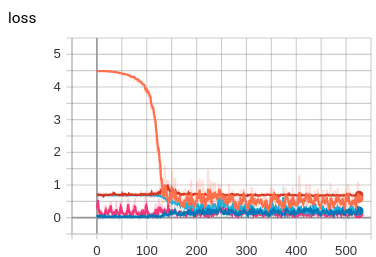
- Visualize the losses and metrics using plots
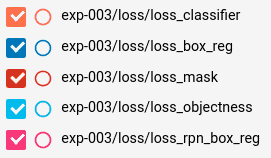
To visualize losses in TensorBoard, .add_scalar() function is used. Often in PyTorch training code, there is a get_loss() function that returns the dictionary of all loss values calculated in the model, e.g. in the previous post. We can feed this dictionary straight into built-in .add_scalars() function (which conveniently wraps .add_scalar() method) and get the desired loss plots.
We can use .add_scalar() function for each item in the dictionary. But it is still not great as we will end up with a lot of empty space.
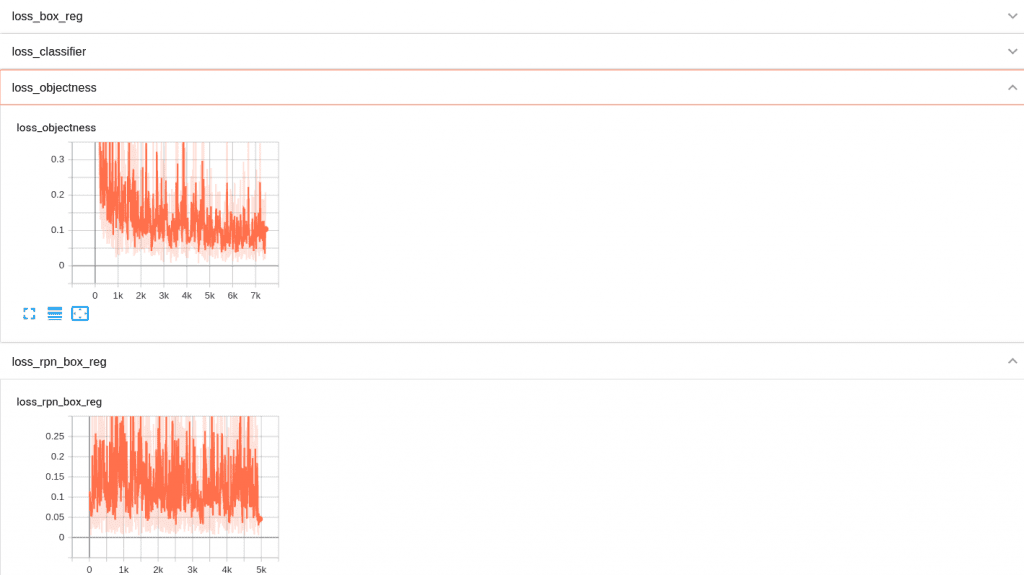
Fortunately, we can combine plots to subgroups by adding a loss/ prefix (or any other tag) to a group of loss dictionary keys. As an example, we extended SummaryWriter by adding the following function:
# create a new class inheriting from tensorboardX.SummaryWriter
class SummaryWriter(tensorboardX.SummaryWriter):
    def __init__(self, log_dir=None, comment="", **kwargs):
        super().__init__(log_dir, comment, **kwargs)
    # create a new function that will take dictionary as input
    # and uses built-in add_scalar() function
    # that function combines all plots into one subgroup by a tag
    def add_scalar_dict(self, dictionary, global_step, tag=None):
        for name, val in dictionary.items():
            if tag is not None:
                name = osp.join(tag, name)
            self.add_scalar(name, val.item(), global_step)
Now, we can use our custom function in the training loop. And it looks much better:
for images, targets in metric_logger.log_every(
    data_loader, print_freq, header
):
    images = list(image.to(device) for image in images)
    targets = [{k: v.to(device) for k, v in t.items()} for t in targets]
    loss_dict = model(images, targets)

    # let's track the losses here by adding scalars
    tensorboard.logger.add_scalar_dict(
        # passing the dictionary of losses
        # (pairs - loss_key: loss_value)
        loss_dict,
        # passing the global step (number of iterations)
        global_step=tensorboard.global_iter,
        # adding the tag to combine plots in a subgroup
        tag="loss"
    )
    # incrementing the global step (number of iterations)
    tensorboard.global_iter += 1
So we can easily customize TensorBoard by adding functions and reusing the existing methods for logging.
Images
When training object detection model, it would be great to see how the predicted bounding boxes and labels are changing during the process. They can be tracked with .add_image_with_boxes().
# let's add tracking images with predicted bounding boxes
tensorboard.logger.add_image_with_boxes(
    # adding pred_images tag to combine images in one subgroup
    "pred_images/PD-{}".format(i),
    # passing image tensor
    img,
    # passing predicted bounding boxes
    outputs[0]["boxes"].cpu(),
    # mapping & passing predicted labels
    labels=[
        tensorboard.COCO_INSTANCE_CATEGORY_NAMES[i]
        for i in outputs[0]["labels"].cpu().numpy()
    ],
)
So each time we add a new image, it will be saved and can be seen using a slider.
Configs and metrics
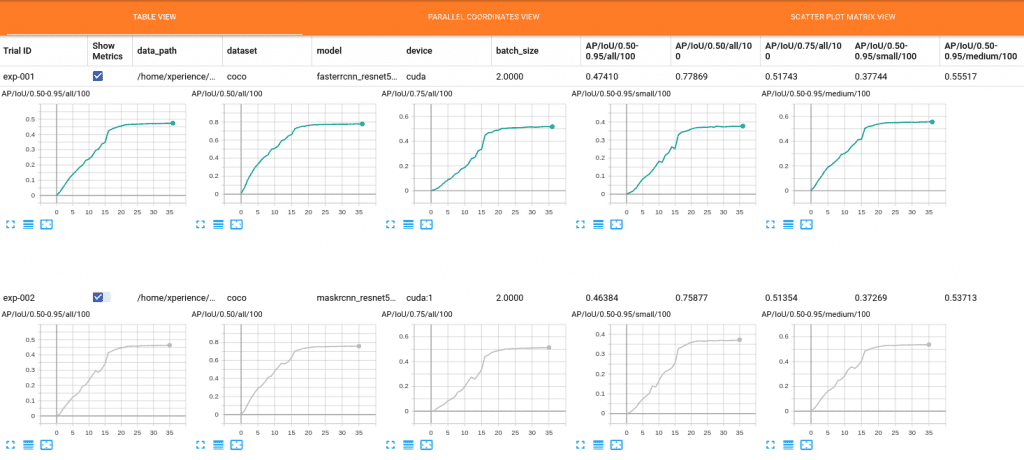
The two most important things we want to log are our settings, i.e. hyperparameters, and experiment results – our achieved metric values. That can be done using.add_hparams() where we pass hparams dictionary and metric values.
# let's add hyperparameters and bind them to metric values
tensorboard.logger.add_hparams(
    # passing hyperparameters dictionary (in our case argparse values)
    tensorboard.args,
    # passing COCO metrics
    {
        "AP/IoU/0.50-0.95/all/100": coco_eval.stats[0],
        "AP/IoU/0.50/all/100": coco_eval.stats[1],
        "AP/IoU/0.75/all/100": coco_eval.stats[2],
        "AP/IoU/0.50-0.95/small/100": coco_eval.stats[3],
        "AP/IoU/0.50-0.95/medium/100": coco_eval.stats[4],
        "AP/IoU/0.50-0.95/large/100": coco_eval.stats[5],
        "AR/IoU/0.50-0.95/all/1": coco_eval.stats[6],
        "AR/IoU/0.50-0.95/all/10": coco_eval.stats[7],
        "AR/IoU/0.50-0.95/all/100": coco_eval.stats[8],
        "AR/IoU/0.50-0.95/small/100": coco_eval.stats[9],
        "AR/IoU/0.50-0.95/medium/100": coco_eval.stats[10],
        "AR/IoU/0.50-0.95/large/100": coco_eval.stats[11],
    },
    name=".",
    # passing the current iteration (epoch)
    global_step=tensorboard.total_epochs,
)
# incrementing the number of epochs
tensorboard.total_epochs += 1
Now, in a new HPARAMS tab we can see the metrics and config parameters as well as how hyperparameters influence metrics.

Summary
TensorBoard is a powerful tool that makes experiment tracking easier, requires minimal code update and a small amount of time to start using it in your project. It saves everything in a file that can be easily transferred to any machine and can be stored in git repository under git-lfs or Data Version Control. It’s easy to install and does not require any additional software. The main weakness is that it does not save code changes.
Weights & Biases
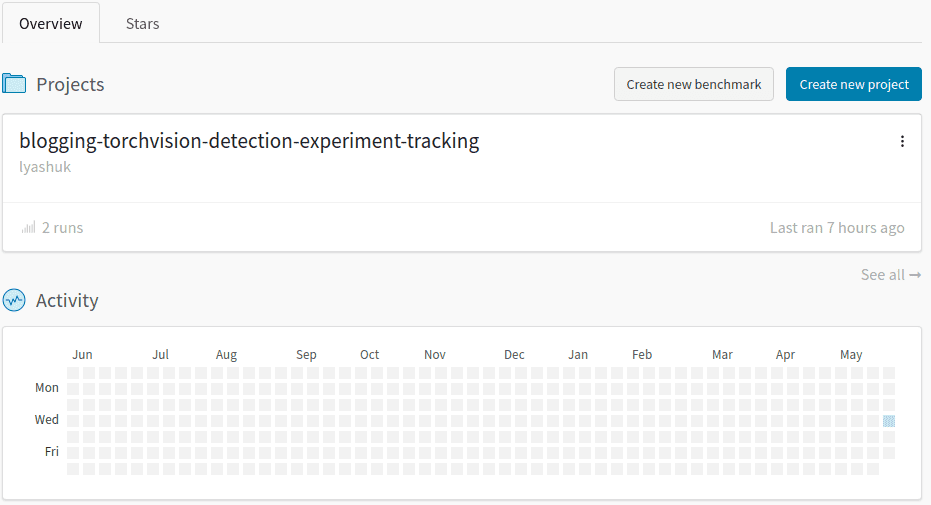
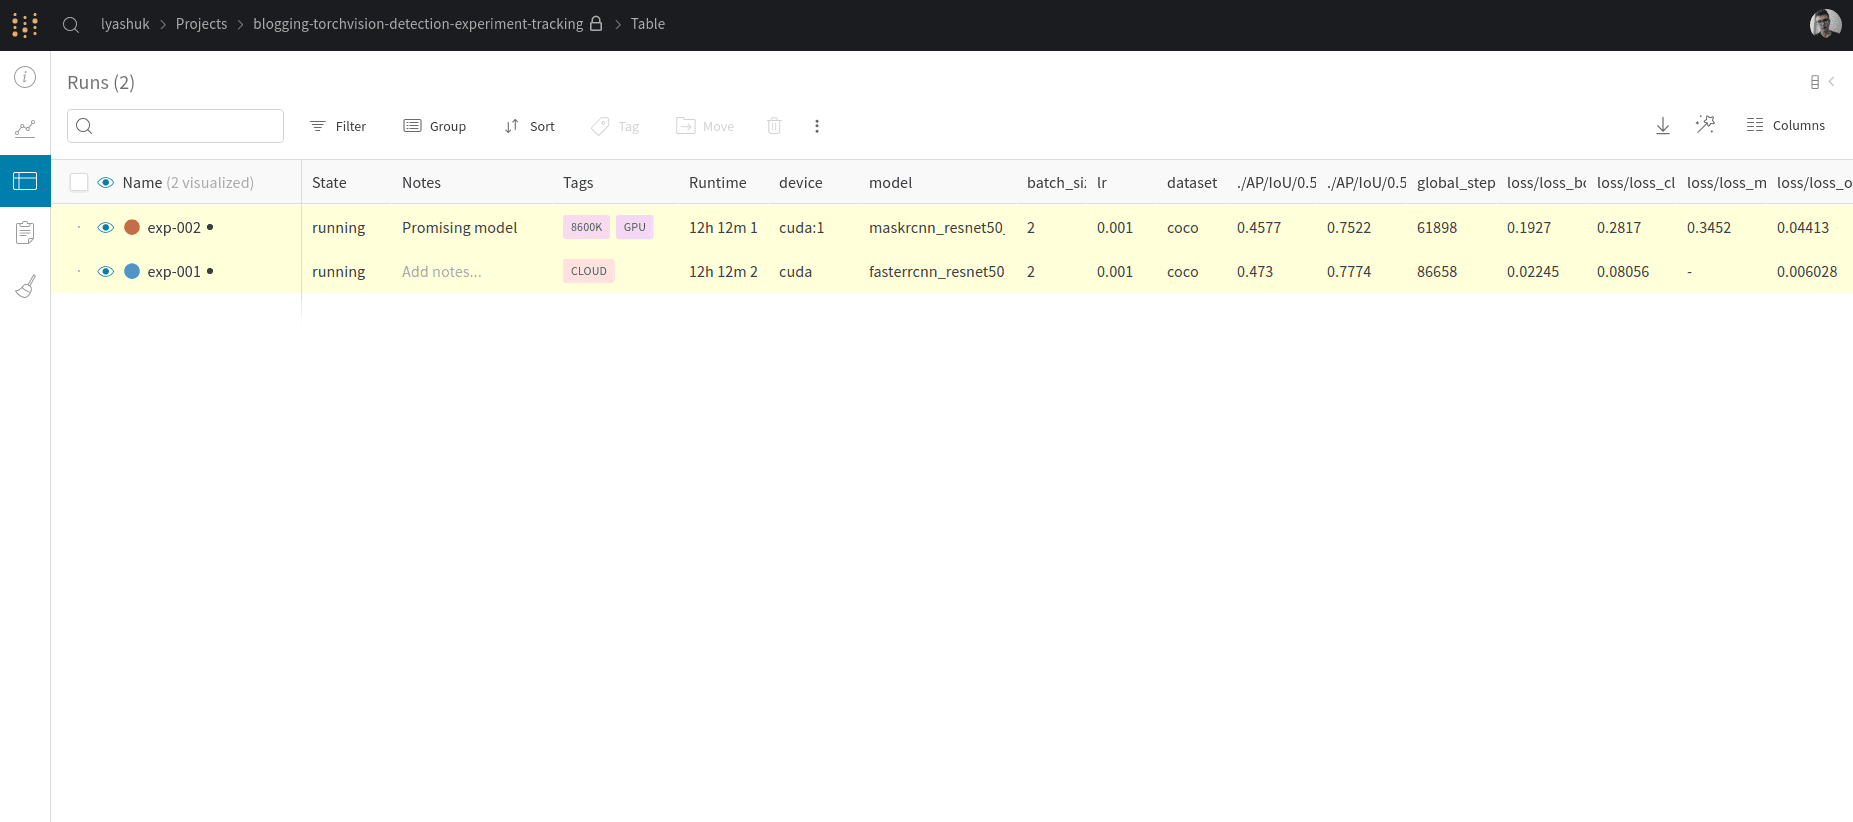
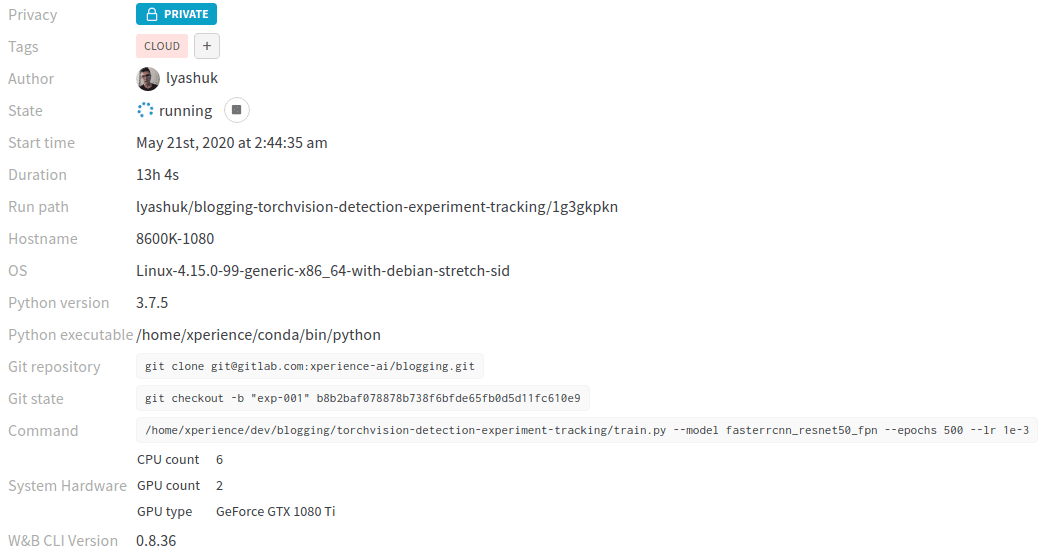
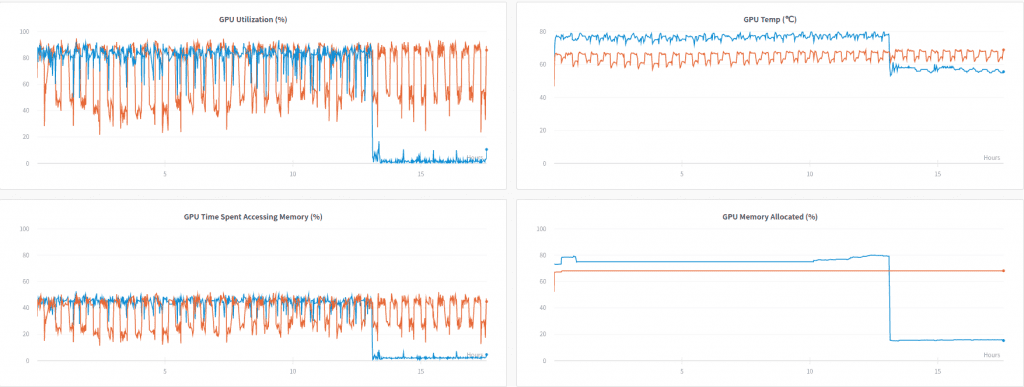
Weights & Biases is the tool where magic begins. This experiment tracking tool belongs to 50/50 solutions when code is run on your machine while the logging is in the cloud. It’s free for personal use and free unlimited private projects are provided. With this tool, it’s possible to track system resources and even kill experiments just by clicking a button in a browser.
It can be easily installed from PyPi by typing the following in CLI:
pip install wandb
Then, you need to sign up using its website and log in using CLI:
wanbd login
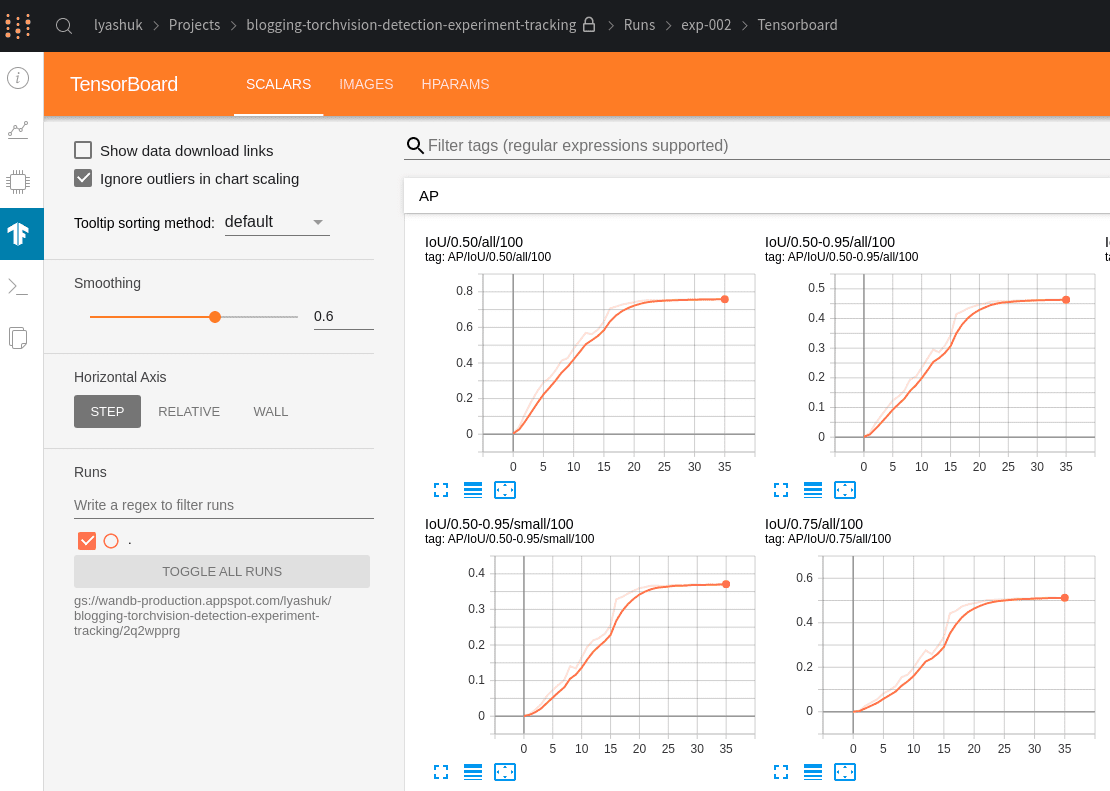
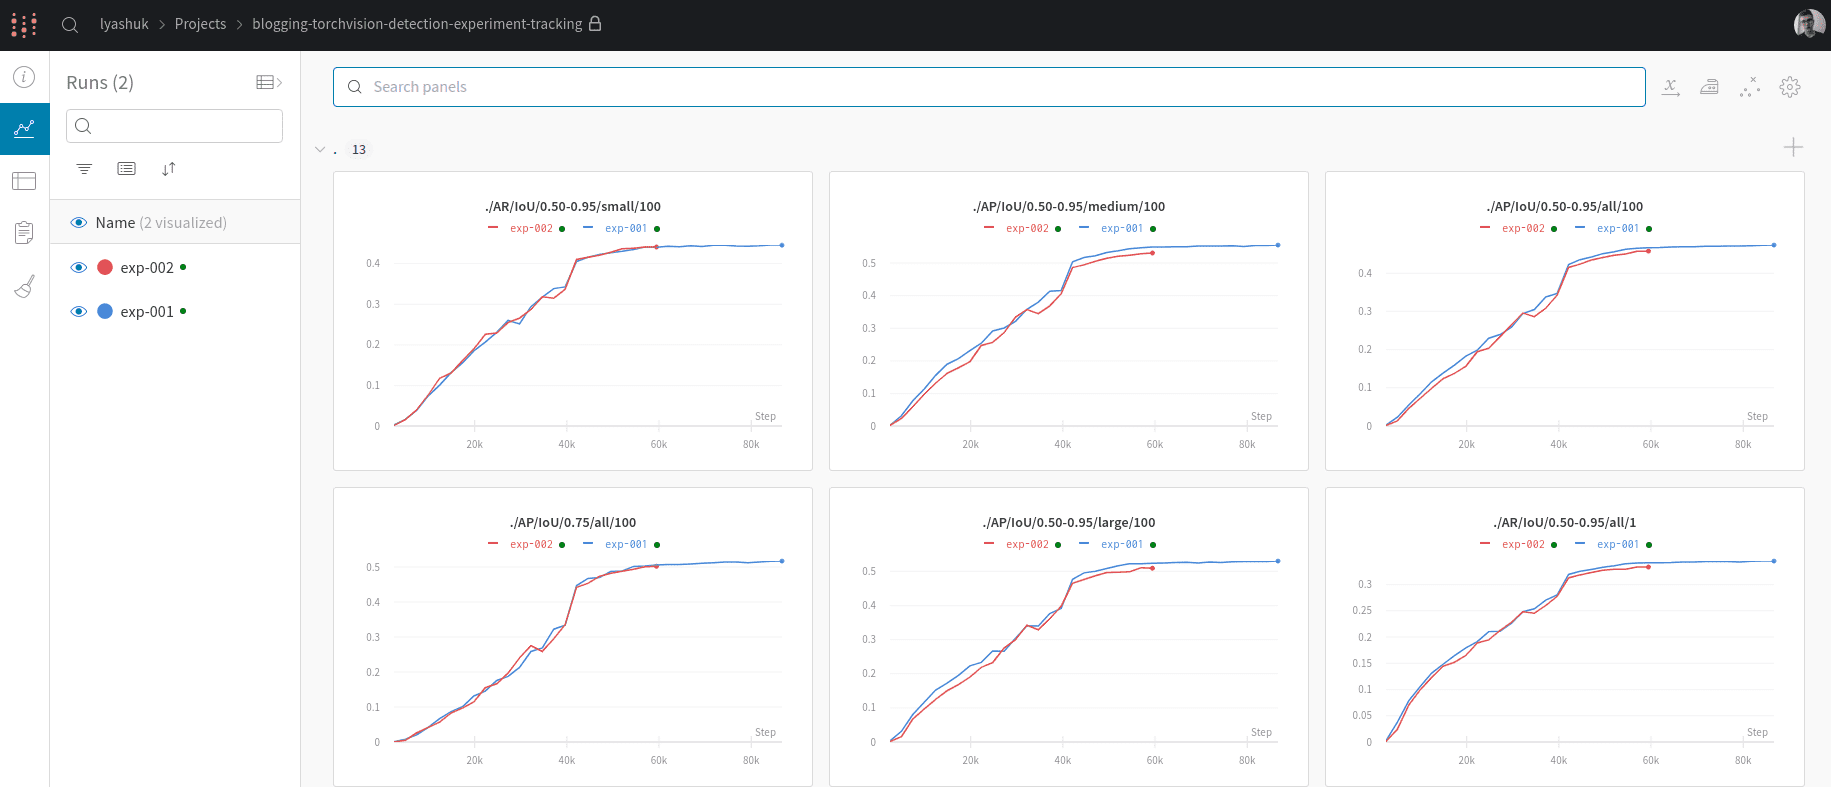
The only thing you need to do is to paste the created key from your browser to CLI. Here we go! This is the step where magic starts. By adding two lines in our code, we can duplicate losses and metrics written using TensorBoard into the cloud and provide new features like automatic VCS, resource monitoring, TensorBoard instance, etc. Just two lines! Let’s do this!
# init wandb using config and experiment name
wandb.init(config=vars(args), name=tensorboard.name)
# enable tensorboard sync
wandb.init(sync_tensorboard=True)
Now, we can open a browser from any device to have a look at the training process.
By adding just two lines in our code we got a powerful tool for experiment management. It’s not required to understand how to perform logging using W&B. If you are already familiar with TensorBoard, the W&B does it for you.
What about privacy solutions
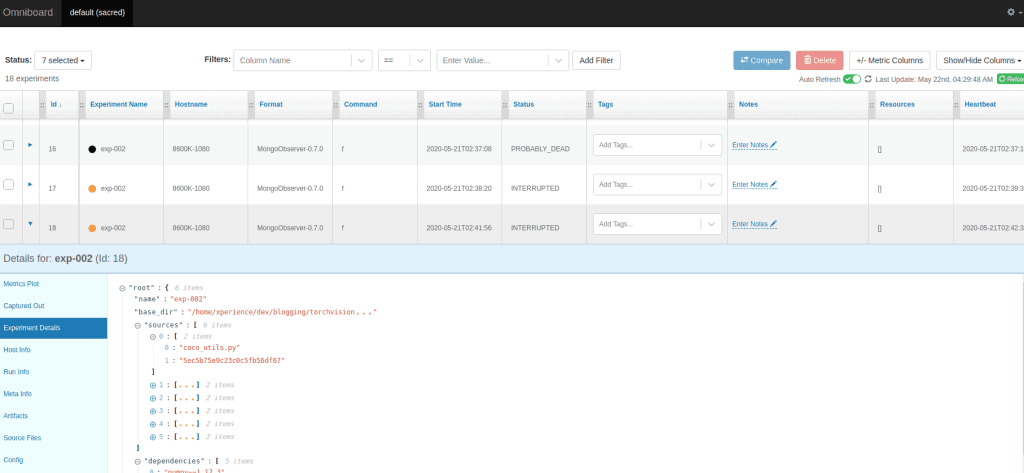
Weights & Biases is a great tool, but you could probably ask if an offline open-source solution exists. The answer would be Sacred + Omniboard. This pair represents the best offline and free of charge choice, especially for privacy & security reasons.
Sacred is a python module which is used to save metrics, configurations, code changes and other stuff in a MongoDB database. Omni-board is a server that reads data from the MongoDB and provides visualization.
You could ask why we used W&B when such a good solution exists. The reasons are
- Installation process is much harder, as you need to install MongoDB >= 4.0 and Node.js, you also need to decorate your code.
- Less features and UX, lack of support (only 3 commits in the repository in 2020 by June).
- No magic with TensorBoardX (however, it works with tensorflow.FileWriter). So if you used PyTorch + TensorBoard before, you have to rewrite logging.
Here is a screenshot of Sacred + Omniboard usage.
Conclusion
Solutions for experiment management already exist and are used by many researchers and AI engineers. Keep in mind that only three tools were described in this post while there are a lot of other possible solutions for experiment logging. As a personal recommendation, TensorBoard is a good tool to start with as other frameworks try to support it and it’s not required to learn any new syntax. For personal use, W&B is a good choice too. The last but not least if you use tensorflow and are restricted by confidential policy, Sacred + Omniboard is a solution to consider.


