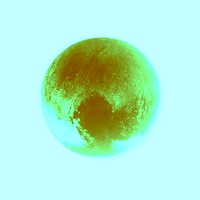
In this tutorial we will first show a simple way to pseudocolor / false color a grayscale image using OpenCV’s predefined colormaps. We will also show a way to define a custom colormap if you would rather use your own. As always I am sharing C++ and Python code that you can download here.
This post is dedicated to NASA’s New Frontiers program that has helped explore Jupiter, Venus, and now Pluto!
Often grayscale images of planets and other objects in space are pseudo colored to show detail, and to mark regions corresponding to different materials with different colors. We will use one of the grayscale photos of Pluto taken by New Horizons as an example in this tutorial.
What is a colormap ?
Let’s say we want to show the temperature in different parts of the United States on a map. We could overlay temperature data on top of a US map as a grayscale image — darker regions representing cooler temperatures, and brighter regions representing hotter regions. Not only is such a representation incredibly boring, it is a bad representation for two big reasons. First, the human visual system is not optimized to measure small changes in grayscale intensities. We are way better at perceiving changes in color. Second, we associate different meanings with different colors. It is much more meaningful to represent cooler temperatures using blue and warmer temperatures using red.
Temperature data is just one example, but there are several other cases where the data is single valued (grayscale), but it makes sense to convert it to color data for visualization. Other examples of data that are better visualized by pseudo-coloring are height, pressure, density, humidity so on and so forth.
Using applyColorMap in OpenCV
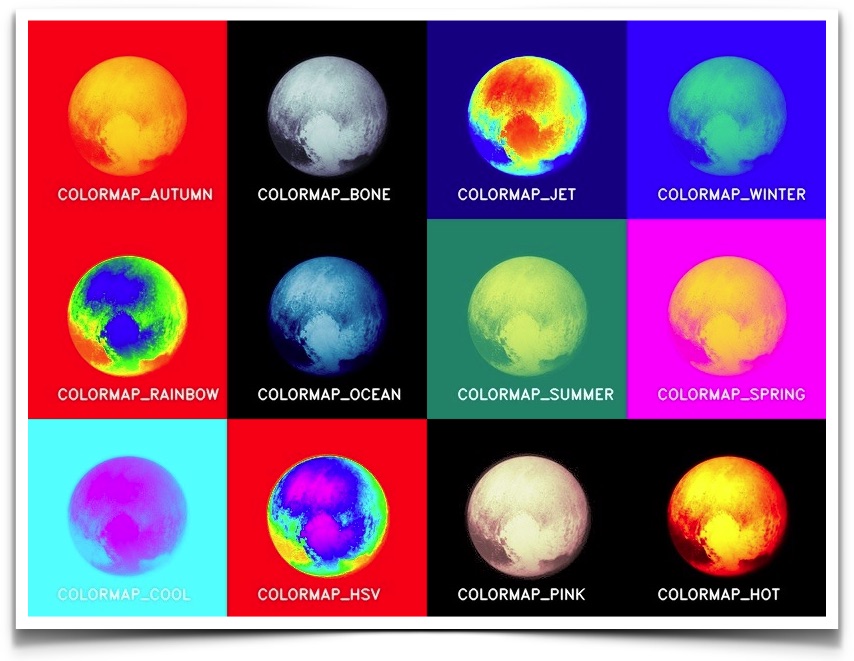
OpenCV defines 12 colormaps that can be applied to a grayscale image using the function applyColorMap to produce a pseudocolored image. Let’s quickly see how to apply colormap COLORMAP_JET to an image.
C++
using namespace cv;

Mat im_gray = imread("pluto.jpg", IMREAD_GRAYSCALE);
Mat im_color;
applyColorMap(im_gray, im_color, COLORMAP_JET);
Python
import cv2

im_gray = cv2.imread("pluto.jpg", cv2.IMREAD_GRAYSCALE)
im_color = cv2.applyColorMap(im_gray, cv2.COLORMAP_JET)
The figure below shows a visual representation of colormaps and the numeric values of COLORMAP_*. Lower grayscale values are replaced by colors to the left of the scale while higher grayscale values are to the right of the scale.
| Value | Name | Scale |
| 0 | COLORMAP_AUTUMN | |
| 1 | COLORMAP_BONE | |
| 2 | COLORMAP_JET | |
| 3 | COLORMAP_WINTER | |
| 4 | COLORMAP_RAINBOW | |
| 5 | COLORMAP_OCEAN | |
| 6 | COLORMAP_SUMMER | |
| 7 | COLORMAP_SPRING | |
| 8 | COLORMAP_COOL | |
| 9 | COLORMAP_HSV | |
| 10 | COLORMAP_PINK | |
| 11 | COLORMAP_HOT |
Custom Colormaps

There are some people who are never satisfied with the menu at a restaurant. The chef’s expertise in selecting the ingredients notwithstanding, they are going to customize their dish by adding, replacing, and substituting ingredients. Oh yeah, those people.
If you happen to be one of those people, and want to create your own colormap (what’s wrong with the 12 colormap for God’s sake ? ), here are the steps.
- Define a colormap : A colormap is a mapping from 0-255 values to 256 colors. In OpenCV, we need to create an 8-bit color image of size 256 x 1 to store the 256 color values.
- Map the colors using a lookup table : In OpenCV you can apply a colormap stored in a 256 x 1 color image to an image using a lookup table LUT.
C++
Mat im_color;
// NOTE : im_gray is 3-channel image with identical red, green, blue channels.
LUT(im_gray, lut, im_color);
Python
# NOTE : im_gray is 3-channel image with identical red, green, blue channels.
im_color = cv2.LUT(im_gray, lut)
You can download the C++ and Python code for custom colormaps and other images used in this post in the section below. Additional colormaps can be found at colormap.org. The image shown above was transformed using a modified version of one of their colormaps. I call this colormap algae!


100K+ Learners
Join Free OpenCV Bootcamp3 Hours of Learning