Vision-Language Models (VLMs) are powerful and figuring out how well they actually work is a real challenge. There isn’t one single test that covers everything they can do. Instead, we need to use the right datasets and the right VLM Evaluation Metrics.
Inside this blog post, you will find the following concepts.
- About various VLM Tasks.
- Review of different Datasets and Benchmarks.
- Python script for retrieving BLEU score on smolVLM-instruct.
- Why VLM Evaluation Metrics?
- What Tasks VLMs Can Perform?
- Visual Question Answering (VQA) and Visual Reasoning
- Document, Chart, and OCR Understanding
- RefCOCO: Visual Grounding and Referring Expression Comprehension
- MSCOCO: Image Captioning Dataset
- Python script to check BLEU score of smolVLM-instruct
- Putting It Together: Which Evaluation Metric and When to use them?
- Conclusion
Why VLM Evaluation Metrics?
Evaluation of VLMs is not as simple as evaluating a vision or object detection model. It requires task-wise datasets and corresponding evaluations. The reason is simple. A model which excels in logical reasoning needed for VQA might struggle with the semantic richness required for high-quality image captioning. Similarly, the skills needed to read an invoice are different from pinpointing an object in a cluttered scene.
We will go through various tasks, respective datasets and essential VLM evaluation metrics. Continuing with Python script to calculate the BLEU score on smolVLM-instruct model.
Let’s begin 🙂
What Tasks VLMs Can Perform?
A vision language model is much more robust in terms of tasks that it can perform. Given the fact that it has the capability to generate results based on scene and texts input. Following are some of the tasks for which VLMs are currently used.
- Visual Question Answering(VQA)
- Document, Chart and OCR understanding
- Visual Grounding and Referring Expression Comprehension
- Image Captioning
Let’s go through the tasks in detail below. We will visualize corresponding datasets, and relevant VLM evaluation metrics.
Visual Question Answering (VQA) and Visual Reasoning
Visual Question Answering (VQA) is one of the most basic task that a VLM can perform. It checks if a model can really understand an image and give the right answer to a question asked in natural language. Let’s have a look at three of VQA datasets namely: VQAv2, GQA and MMBench.
3.1 VQAv2: Upgrade on classical VQA dataset
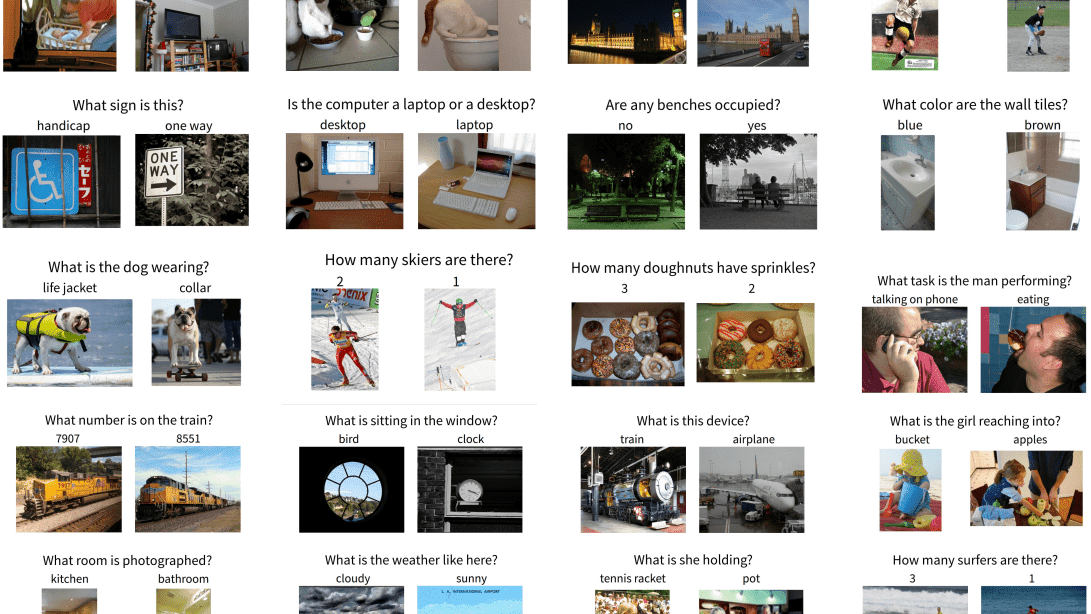
What is VQAv2?
VQAv2 is built upon the rich and diverse images of the MS-COCO dataset and contains over 200,000 images paired with more than 1.1 million questions. Many improvements were made on top of VQAv1 to make this dataset more robust and explanatory.
Flaws in VQAv1 Dataset
- The initial version of the dataset suffered from language priors. Researchers discovered that models could often achieve surprisingly high accuracy by learning statistical correlations from the questions alone, effectively bypassing the visual information in the image.
- For example, if a model saw many questions starting with “What color are the …?“, it would learn to answer “yellow” without ever looking at the image, as this was the most common answer in the dataset. This meant that high scores on VQAv1 were not a reliable indicator of true visual understanding.
Improvements in VQAv2
- Primary improvement in VQAv2 was re-balancing of the dataset to mitigate these language biases. For each question in the dataset, the creators ensured there was at least one complementary pair.
- This means that for a given question about an image (e.g., “Is the man wearing glasses? – Yes”), the dataset also includes a different, visually similar image where the answer to the exact same question is the opposite (e.g., “Is the man wearing glasses? – No”). This balancing makes the model to reason its answer in the visual content of the specific image it is shown.
- A second improvement in VQAv2 was the expansion of answer annotations. While VQAv1 provided two human answers per question, VQAv2 expanded this to ten distinct, human-provided answers. .
VLM Evaluation Metrics for VQAv2
Consensus Accuracy: This dataset was built by keeping in mind that people don’t always use the same words for same objects like one person might say “couch,” another might say “sofa.” Instead of expecting one “perfect” answer, it collects a variety of correct ones and uses consensus accuracy.
![]()
3.2 GQA: Compositional Question Answering
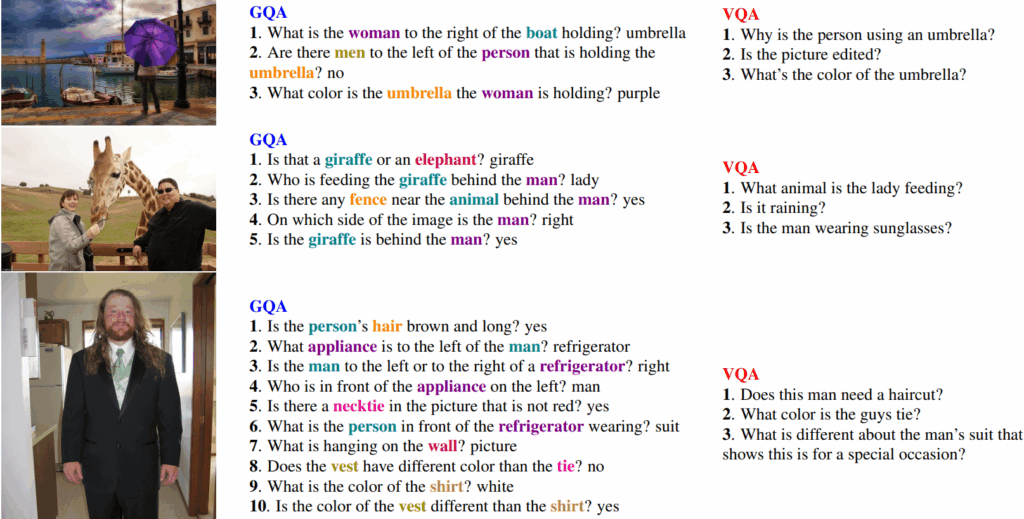
What is GQA Dataset?
GQA (Graph Question Answering) is a benchmark for visual reasoning designed to test a model’s ability to answer complex, multi-step questions about real-world images. Its key feature is the use of a sophisticated engine that generates questions from detailed scene graphs, which are structured maps of an image’s objects, their attributes, and the relationships between them.
This approach ensures that questions are deeply grounded in the image’s content and require genuine compositional understanding.
Flaws in VQAv2 Dataset
- While VQAv2 was a significant improvement over VQAv1, it still had limitations. Its balancing efforts were most effective for binary (yes/no) questions, leaving open-ended questions vulnerable to language priors, for example guessing that anything asked about “sport” is likely “tennis” .
- Furthermore, the reasoning required for many questions remained relatively shallow.
Improvements Made in GQA
- By programmatically generating questions, GQA gained control over the answer distributions for all question types, significantly reducing biases and making much harder for models to succeed without looking at the image.
- The questions in GQA are also inherently more compositional, meaning that a chain of logical steps are required to arrive at an answer. This pushes models beyond simple object recognition towards more complex spatial, relational, and logical reasoning.
VLM Evaluation Metrics Used for GQA Dataset
The structured nature of GQA enabled the introduction of new diagnostic metrics apart from accuracy such as:
- Consistency: Measures if the model provides logically compatible answers to a set of related questions.
- Validity & Plausibility: Checks whether an answer is of the correct type (e.g., a color for a color question) and is reasonable in a real-world context.
- Grounding: For attention-based models, this assesses whether the model focuses on the relevant image regions when forming its answer.
3.3 MMBench: Recent Benchmark
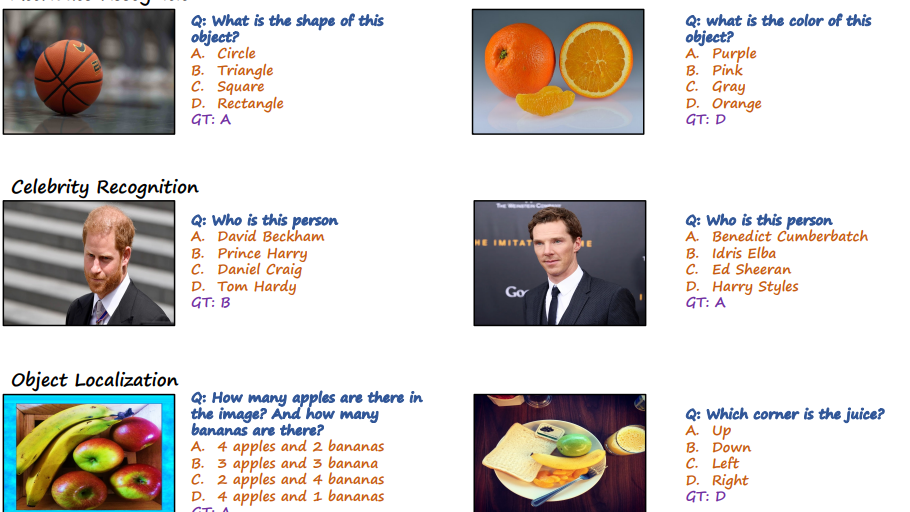
What is MMBench?
MMBench (Multi-modality Benchmark) is a modern benchmark designed to provide a broad and challenging evaluation of a Vision-Language Model’s diverse capabilities.
It consists of approximately 3,000 single-choice questions that systematically cover 20 different ability dimensions. These skills range from fundamental perception (e.g., object and attribute recognition) and OCR (text recognition in posters, signs) to high-level cognition (e.g., commonsense reasoning, logic, math, and chart/figure interpretation).
MMBench is available in both English and Chinese and is maintained with a public leaderboard, making it a standard for comparing the general intelligence of state-of-the-art VLMs.
Flaws in previous Benchmarks
Public datasets, such as VQAv2, COCO Caption, GQA, and OKVQA, haven been proved valuable resources for the quantitative evaluation of VLMs. These datasets offer objective metrics, including accuracy, BLEU, CIDEr, etc.
- However, when employed to evaluate more advanced LVLMs, these benchmarks encounter the following challenges.
- False Negative Issues: Existing evaluation metrics require an exact match between the prediction and the reference target, leading to potential limitations.
- For example, in the VQA task, even if the prediction is “bicycle” while the reference answer is “bike”, the existing metric would assign a negative score to the prediction, resulting in a considerable number of false-negative samples.
- Lacking Fine Grained Analysis: Current public datasets predominantly focus on evaluating a model’s performance on specific tasks, offering limited insights into the fine-grained capabilities of these models.
- False Negative Issues: Existing evaluation metrics require an exact match between the prediction and the reference target, leading to potential limitations.
Metrics Used for MMBench Dataset
Accuracy: This metric is calculated as the percentage of questions the model answers correctly out of the total number of questions. On the standard test set of 2,974 questions, the equation is:
![]()
Note: While the total accuracy score is the main metric for ranking on the leaderboard, analyses often include a breakdown of scores per ability dimension. This provides a more fine-grained diagnostic of a model’s specific strengths and weaknesses (e.g., showing a model excels at OCR but struggles with logical reasoning).
Document, Chart, and OCR Understanding
Another application of VLM is extracting information from structured and semi-structured visual content like documents, charts, and text-rich images.
Now, let’s have a look at some of the Benchmarks which are popular for evaluating on OCR and Chart understanding tasks namely: DocVQA and ChartQA.
4.1 DocVQA: Reasoning Over Scanned Documents
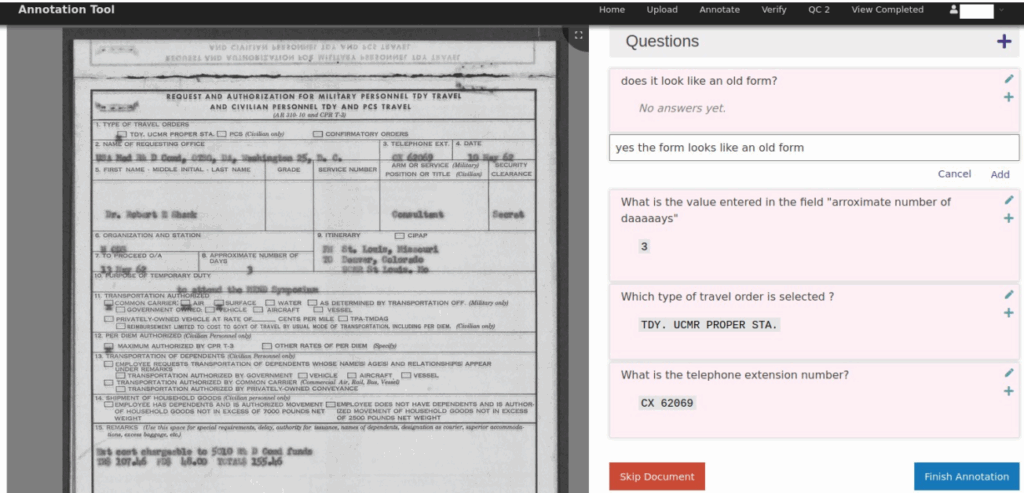
What is DocVQA?
The dataset contains over 12,000 document images (scanned and born-digital) with more than 50,000 human-generated questions. The core challenge requires a model to integrate three distinct skills such as: OCR to read the text, Layout Understanding to comprehend the spatial structure of the document (e.g., tables, forms, lists), and Natural Language Reasoning to answer a question based on the extracted information.
Flaws in Previous OCR Benchmarks
- VQA like TextVQA, primarily focused on “scene text” like the text appearing inside an image (e.g., on street signs or storefronts). This text is often short, sparse, and lacks complex layout.
- These benchmarks were insufficient for testing the ability to understand structured information where the position of text is critical to understand the meaning. For example, they could not evaluate if a model could find the “Total Amount” on an invoice. As this is a tasks which requires an understanding of the document’s layout.
Highlights of DocVQA
DocVQA’s main improvement was creating the first large-scale benchmark dedicated to the document domain, shifting the focus from simple text recognition to holistic document intelligence. This forced models to develop more sophisticated architectures that could process and relate visual layout with textual semantics.
Metrics for DocVQA Dataset
Average Normalized Levenshtein Similarity (ANLS):
- This is the primary metric.
- It measures the similarity of the predicted answer to the ground truth, even with small OCR errors.
- Levenshtein distance: Minimum number of single-character edits (insertions, deletions, or substitutions) required to change one string into the other.

- where
 of some string
  is a string of all but the first character of
  (i.e.
(i.e.  ), and
  is the first character of
  (i.e.
(i.e.  ). Either the notation
 ![$x[n]$](https://learnopencv.com/wp-content/ql-cache/quicklatex.com-87c8ce60995c030c4f4e52563f750cd5_l3.png) or
or  is used to refer to the
  character of the string
  , counting from 0, thus
 ![$\operatorname{head}(x) = x_0 = x[0]$](https://learnopencv.com/wp-content/ql-cache/quicklatex.com-b9847125473abf9a874a8f8659e53e4e_l3.png) .
.
- The final score is the average ANLS over all questions, with a value of 1.0 indicating a perfect match and higher scores being better.
Accuracy (Exact Match):
- This is the secondary metric.
- Measures the percentage of answers that are perfectly correct with no errors. It provides a stricter measure of performance.
4.2 ChartQA: Reasoning over Charts and Plots
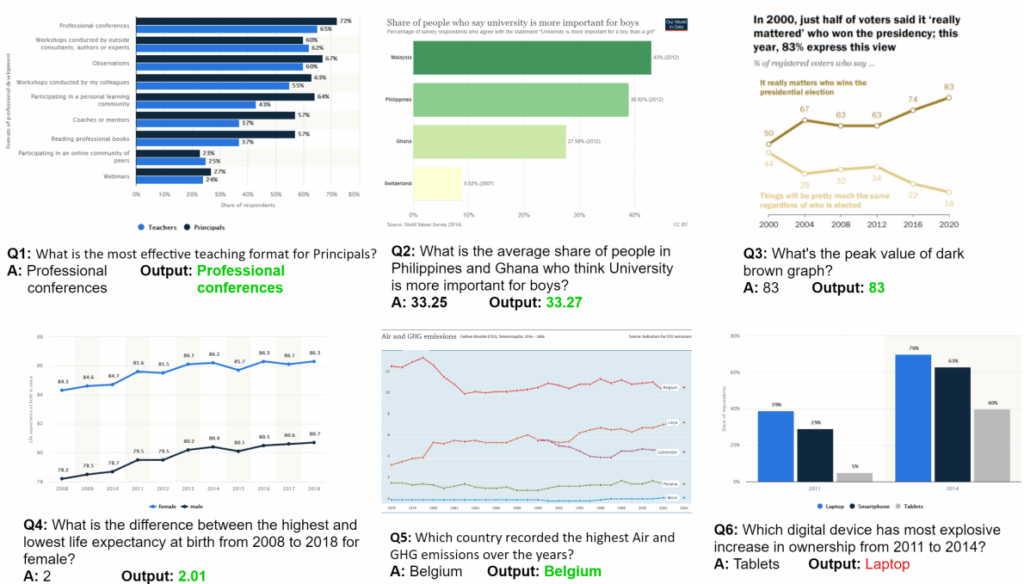
What is ChartQA?
ChartQA is a benchmark designed to test a model’s ability to reason about data presented in charts and plots.
The dataset contains approximately 10,000 charts with over 36,000 questions and split between programmatically generated questions for scale as well as human-authored questions for complexity.
Answering a question in ChartQA requires a multi-step process:
- Visual Parsing to identify chart elements like axes, legends, and data points (bars, lines).
- Data Extraction to convert visual marks into numerical or categorical values.
- Logical/Mathematical Reasoning to perform comparisons, calculations, or trend analysis.
No Previous Benchmarks for Chart Question-Answering
General VQA datasets contained very few charts, and models were unable to process information presented in the format of plots or charts. This created a significant gap, as understanding data visualizations is a critical skill that combines visual perception with structured reasoning.
Metrics for ChartQA Dataset
Accuracy (Relaxed Exact Match):
- Main evaluation metric.
- It is a “relaxed” match because the evaluation protocol first applies a normalization step to both the predicted and ground-truth answers.
- Normalization typically includes:
- Converting text to lowercase.
- Removing punctuation.
- Standardizing numerical representations (e.g., “5 thousand” becomes “5000”).

ANLS: Used as a secondary metric.
RefCOCO: Visual Grounding and Referring Expression Comprehension
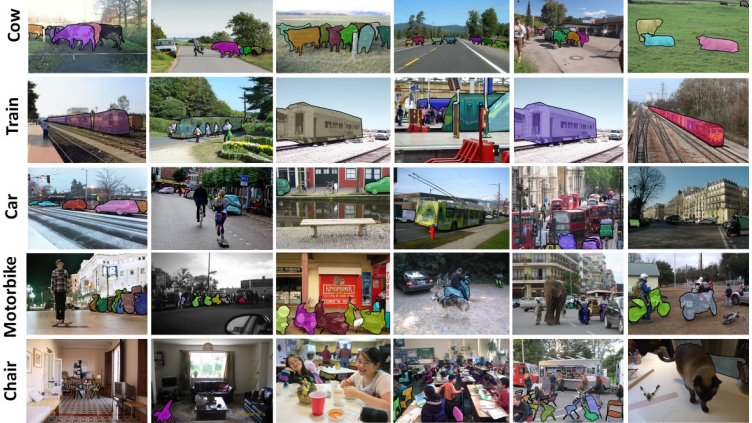
These tasks tests a model’s ability to connect language to a specific region in an image. Given a descriptive phrase, the model must localize the object being referred to. We will taking look at RefCOCO dataset and its variants.

What is RefCOCO family?
The RefCOCO family (consisting of RefCOCO, RefCOCO+, and RefCOCOg) is a collection of large-scale datasets designed for the task of Referring Expression Comprehension.
The core task is of visual grounding in which, when given a natural language phrase that refers to a specific object in an image (e.g., “the woman in the red shirt”), then the model must localize that particular object by predicting its bounding box.
The datasets are built on top of the MS-COCO images and together contain over 140,000 expressions for more than 50,000 objects.
Flaws in Previous Benchmarks
- Before RefCOCO, grounding benchmarks were smaller in scale. General object detection datasets could localize objects, but only from a fixed set of categories.
- To put it in easier terms, standard object detection systems, before RefCOCO, could find all the “persons” in an image, but lacked the language understanding to know which specific person was being referred to by a phrase like “the person on the left.”
Highlights of RefCOCO family
The main contribution of the RefCOCO family was providing a large-scale, standardized benchmark for instance-level visual grounding which was previously absent. T
he family’s key innovation lies in its three distinct splits, each designed to test a different aspect of language understanding:
- RefCOCO: Contains concise, location-focused language. The expressions were collected in an interactive game, resulting in short, efficient phrases (e.g., “middle person”).
- RefCOCO+: Explicitly disallows the use of location words (like “left,” “right,” “top,” “bottom”). This forces models to rely on attribute-based reasoning, distinguishing objects by their appearance (e.g., “the person in the blue shirt” vs. “the person in the green shirt”).
- RefCOCOg: Contains longer, more descriptive, and grammatically complex sentences (e.g., “the person standing in the back with a hat on”).
VLM Evaluation Metrics for RefCOCO family
Accuracy@IoU:
- This is the primary evaluation metric.
- A model’s predicted bounding box is considered correct if its Intersection over Union (IoU) with the ground-truth bounding box is greater than a specified threshold.
- The standard threshold is 0.5.

- The final metric is the percentage of referring expressions for which the predicted box meets this criterion.

MSCOCO: Image Captioning Dataset
Image captioning is a generative task that requires a model to produce a fluent and accurate textual description of an image. In this we will be walking through one of the most popular dataset till date: MSCOCO.
6.1 What is MSCOCO?
MS-COCO (Microsoft Common Objects in Context) Captions is the most accurate benchmark for the task of image captioning. The dataset contains over 330,000 images of complex, everyday scenes. Its defining feature is that each image is paired with five independent, human-written reference captions. The goal for a model is to automatically generate a single, fluent, and accurate sentence that describes the content of a given image.
6.2 Flaws in Previous Caption Benchmarks
Earlier captioning datasets were often smaller in scale (e.g., Flickr8k, Flickr30k) or featured simpler, less cluttered scenes.
A more significant limitation was that many only provided a single reference caption per image. This made automatic evaluation highly problematic, as a single caption cannot capture the full range of valid ways to describe a scene. A model might generate a perfectly correct caption that gets a poor score simply because its wording differs from the single reference.
6.3 Highlights of MSCOCO
MS-COCO’s primary improvement was its extremely large scale and diversity, providing a vast and challenging set of real-world images.
Another contribution of MSCOCO dataset to the field of captioning was the establishment of the multi-reference evaluation paradigm. By providing five captions per image, it created a much more robust and reliable target for automatic evaluation metrics.
This multi-caption setup allows metrics to better approximate human judgment by rewarding a generated caption if it aligns with any of the valid human descriptions. This standardized the evaluation process and enabled the development of metrics like BLEU, METEOR, CIDEr, and SPICE.
VLM Evaluation Metrics for MSCOCO
There are quite a few popular metrics used for Image Captioning on MSCOCO dataset. Let us understand each of them one by one.
7.1 BLEU (Bilingual Evaluation Understudy)
BLEU score is a geometric mean of modified n-gram precisions, multiplied by a brevity penalty.
Equation:
Where:
BPis the Brevity Penalty, which penalizes generated captions that are shorter than the effective reference length. It is calculated as: .
.
Here,
cis the length of the candidate caption andris the effective reference corpus length.p_nis the modified n-gram precision for n-grams of sizen. It’s the ratio of the number of clipped matching n-grams to the total number of n-grams in the candidate caption.w_nare the weights for each n-gram precision, typically uniform (e.g.,w_n = 1/N).- For cumulative BLEU-4,
N=4andw_n = 0.25.
7.2 METEOR (Metric for Evaluation of Translation with Explicit ORdering)
METEOR calculates a score based on the harmonic mean of precision and recall of unigram matches, with a penalty for fragmentation.
Equation:
Where:
 is the harmonic mean of precision (P) and recall (R) for unigram matches between the candidate and a reference caption. The matches can be exact, stemmed, or synonyms.
Note: For METEOR weights recall is higher than precision. Penalty is a fragmentation penalty that penalizes gaps and differences in word order.
7.3 ROUGE-L Score
ROUGE-L(Recall-Oriented Understudy for Gisting Evaluation for Longest Common Subsequence) uses the Longest Common Subsequence (LCS) to measure sentence-level similarity. It’s an F-score combining LCS-based recall and precision.
Equation:
Where:
 is the LCS-based recall. It measures how much of the reference caption is captured in the candidate.
 is the LCS-based precision. It measures how much of the candidate caption is relevant to the reference.
Explanation of Components:
X: The reference caption, with lengthm.Y: The candidate (model-generated) caption, with lengthn. : The length of the Longest Common Subsequence between
 XandY. : A parameter used to balance the importance of precision and recall. When
  is set to a large value, recall is weighted more heavily. If
  , it becomes a standard F1-score.
7.5 CIDEr (Consensus-based Image Description Evaluation)
CIDEr calculates the average cosine similarity between the TF-IDF vectors of the candidate caption and the reference captions, aggregated over different n-gram lengths.
Equation:
The final CIDEr score is a weighted sum over different n-grams (typically n=1 to 4):
Where:
cis the candidate captionRis the set of reference captions. are the TF-IDF weighted vectors for n-grams of length
 nin the candidate and a reference caption, respectively.
The TF-IDF value for an n-gram k is calculated as ![]() .
.
7.6 SPICE (Semantic Propositional Image Caption Evaluation)
SPICE computes an F1-score over semantic tuples (objects, attributes, relations) extracted from scene graphs parsed from the captions.
Equation:
Where:
cis the candidate captionRis the set of reference captions.- The scene graphs are
G(c)for the candidate G(R)for the union of references.- The tuples are extracted as
T(G). P(c, R)is the precision of the semantic tuples:
R(c, R)is the recall of the semantic tuples:
Python Script to Check BLEU Score of SmolVLM-instruct
We’ve discussed the various VLM evaluation metrics like BLEU as well as various VLM Benchmarks. Now, let’s bridge the gap between theory and practice with a hands-on Python script. This example will demonstrate how to use a smolVLM-instruct (a Vision-Language Model) from the Hugging Face Hub, generate captions for images, and evaluate them against reference texts using the BLEU score we’ve learned about.
8.1 Setup and Model Loading
import nltk
from nltk.translate.bleu_score import sentence_bleu, SmoothingFunction

from PIL import Image
import numpy as np
from typing import List, Dict, Any

import warnings
import torch
from transformers import AutoProcessor, AutoModelForVision2Seq

# Download required NLTK data
nltk.download('punkt_tab', quiet=True)
Above code block shows the necessary dependencies that we will be using in building our BLEU evaluation script.
DEVICE = "cuda" if torch.cuda.is_available() else "cpu"
processor = AutoProcessor.from_pretrained("HuggingFaceTB/SmolVLM-Instruct")
model = AutoModelForVision2Seq.from_pretrained(
    "HuggingFaceTB/SmolVLM-Instruct",
    torch_dtype=torch.bfloat16,
    _attn_implementation=None if DEVICE == "cuda" else "eager",
).to(DEVICE)
In the above script flash attention can also be used but due to its build issues, we are omitting it for now.
8.2 Generating Captions using SmolVLM-Instruct Model
messages = [
            {
                "role": "user",
                "content": [
                    {"type": "image"},
                    {"type": "text", "text": "Can you describe the image?"}
                ]
            },
        ]

# Make predictions with smolVLM model
def model_pred(img):
    try:
        # Prepare inputs
        prompt = processor.apply_chat_template(messages, add_generation_prompt=True)
        inputs = processor(text=prompt, images=img, return_tensors="pt")
        inputs = inputs.to(DEVICE)

        # Generate outputs
        generated_ids = model.generate(**inputs, max_new_tokens=500)
        generated_texts = processor.batch_decode(
            generated_ids,
            skip_special_tokens=True,
        )[0]

        return generated_texts

    except Exception as e:
        print(f"Error loading smolVLM model: {e}")
In the above code block we have first demonstrated how to create a chat template for our VLM model so that it understands what type of inputs user will be providing. Then we create a function model_pred which takes an image as input and performs two operations:
- Processing the inputs to make them compatible with the input type of our model using
processor.apply_chat_templatefunction. - Next, we generate VLMs output or caption for the provided image using
generateattribute of our model object.
8.3 Loading Image using Pillow Library
# Load image using Pillow library to perform captionin.
def load_image(image_path: str) -> Image.Image:
    """Load an image from the given path."""
    try:
        return Image.open(image_path)
    except Exception as e:
        print(f"Error loading image {image_path}: {e}")
        return None
8.4 Calculating the BLEU Score
# Compute BLEU score for a single generated text against reference texts.
def compute_bleu_score(reference_texts: List[str], generated_text: str) -> float:
    reference_tokens = [nltk.word_tokenize(ref.lower()) for ref in reference_texts]
    generated_tokens = nltk.word_tokenize(generated_text.lower())

    smoothing = SmoothingFunction().method1
    bleu_score = sentence_bleu(reference_tokens, generated_tokens,
                             weights=(0.25, 0.25, 0.25, 0.25),
                             smoothing_function=smoothing)
    return bleu_score
- This function implements the metric logic.
- It takes the model-generated caption and the list of human references as input and then tokenizes both the references and the generated caption by splitting them into lists of words and converting them to lowercase.
- This is a critical preprocessing step for a fair comparison as it initializes a
SmoothingFunction, best practice to prevent a score of zero if the generated caption contains phrases which cannot be found in any reference provided. - Finally, it calls
nltk.sentence_bleuwithweights=(0.25, 0.25, 0.25, 0.25), which calculates the cumulative BLEU-4 score, the most commonly reported variant.
8.5 The Evaluation Loop
This function loops over a set of images and, for each, generates a caption with model_pred(image) and then computes a BLEU score comparing that caption against one or more human “reference” captions. It accumulates the individual BLEU scores, prints out each example’s generated caption and score, and finally returns both the list of per-image BLEU scores and their average.
# Evaluate VLM on a dataset using BLEU vlm evaluation metric.
def evaluate_vlm(image_paths: List[str], reference_captions: List[List[str]]) -> Dict[str, Any]:
    bleu_scores = []

    for img_path, refs in zip(image_paths, reference_captions):
        image = load_image(img_path)
        if image is None:
            continue

        generated_caption = model_pred(image)
        bleu = compute_bleu_score(refs, generated_caption)
        bleu_scores.append(bleu)

        print(f"Image: {img_path}")
        print(f"Generated: {generated_caption}")
        print(f"References: {refs}")
        print(f"BLEU Score: {bleu:.4f}\n")

    avg_bleu = np.mean(bleu_scores) if bleu_scores else 0.0

    return {
        "individual_bleu_scores": bleu_scores,
       "average_bleu_score": avg_bleu
    }
8.6 Main Function for VLM Evaluation Metric BLUE
This script defines a main() routine that includes our our mini dataset as hown in the code below. It contains a list of dictionaries, where each entry contains the path to an image. The function iterates through each item in the dataset, loads the image, calls model_pred to get a caption, and then calls compute_bleu_score to get the score.
def main():
    dataset = [
        {
            "image_path": "MEDIA/surf.jpg",
            "references": [
                "A close-up of a purple flower with a small insect resting on one of its petals.",
                "A delicate pinkish-purple bloom with a bright yellow center and a fly resting on the petal.",
                "A single daisy-like flower captured in detail, with soft petals and a visiting insect."
            ]
        },
        {
            "image_path": "MEDIA/sample_image_2.jpg",
            "references": [
                "A surfer in a red shirt riding a wave on a yellow and white surfboard.",
                "A man skillfully carving through the ocean surf as water splashes around him.",
                "A wave crashes while a surfer balances low on his board, maintaining speed and control."
            ]
        }
    ]

    image_paths = [item["image_path"] for item in dataset]
    reference_captions = [item["references"] for item in dataset]

    results = evaluate_vlm(image_paths, reference_captions)

    print("Evaluation Summary:")
    print(f"Average BLEU Score: {results['average_bleu_score']:.4f}")
    print(f"Individual BLEU Scores: {[f'{score:.4f}' for score in results['individual_bleu_scores']]}")

if __name__ == "__main__":
    main()
Putting It Together: Which VLM Evaluation Metric and When to Use them?
- Open-ended QA on images (VQAv2/GQA)
- VQA consensus accuracy; includes consistency/grounding diagnostics for GQA.
- Document & OCR QA (DocVQA)
- ANLS (primary) and accuracy/F1 (secondary).
- Charts (ChartQA)
- Use exact match with normalization; if symbolic variations occur, adopt ANLS-style soft matching and state it.
- Grounding / Referring
- IoU-based accuracy.
- Note: Clean RefCOCO splits if making use of them.
- Captioning
- CIDEr + SPICE; include BLEU and ROUGE-L/METEOR.
- Publishing code for tokenizer and normalization is essential (e.g., punctuation rules).
- Hallucination diagnostics
- POPE and HallusionBench/MMHal-Bench.
VLM Evaluation Metrics Conclusion
Evaluating Vision-Language Models (VLMs) is tricky but very important. It’s not just about scoring high on one leaderboard rather it’s about really understanding what a model can and cannot do. To achieve this, we need the right mix of datasets and vlm evaluation metrics. For example, VQAv2 checks general question answering, while GQA tests reasoning while for image captioning tasks metrics like BLEU measure surface similarity while SPICE provides a good source for evaluating semantic correctness. This balanced approach helps us build VLMs that are not only powerful but also reliable and consistent. Check out this repository from facebook.
With this we wrap up VLM evaluation metrics. I hope you enjoyed reading the article and it helped you to some extent. Please feel free to drop in comments for doubts or feedbacks if any. Happy Learning!







100K+ Learners
Join Free OpenCV Bootcamp3 Hours of Learning