A picture is worth a thousand words! As computer vision and machine learning experts, we could not agree more.

Human intuition is the most powerful way of making sense out of random chaos, understanding the given scenario, and proposing a viable solution if required. Moreover, the best way to infer something is by looking at it (visualizing it). Therefore data visualization is becoming extremely useful in enabling our human intuition to come up with faster and accurate solutions. In fact, data science and machine learning makes use of it day in and day out
Visualization comes in handy for almost all machine learning enthusiasts. We use it for
- Debugging models based on accuracy curves
- Testing model’s robustness from PR curves
- Analyzing learning convergence based loss curves
- Describing model performance using a confusion matrix
What is covered in this post
We know deep down inside that we require visualization tools to supplement our development. One way could be to make our own small snippets for each making graphs using matplotlib or any other graphing library. Or we can make use of the TensorBoard’s visualization toolkit.
In our last post (Getting Started with PyTorch Lightning), we understood how to reduce the boilerplate code by using PyTorch Lightning. In this post, we will learn how to include Tensorboard visualizations in our Lightning code.
In this post, we will learn how to
- Plot accuracy curves
- Visualize model’s computational graph
- Plot histograms
- View activations of the input image as it flows through the network.
So let’s get started!!!
What is Tensorboard?
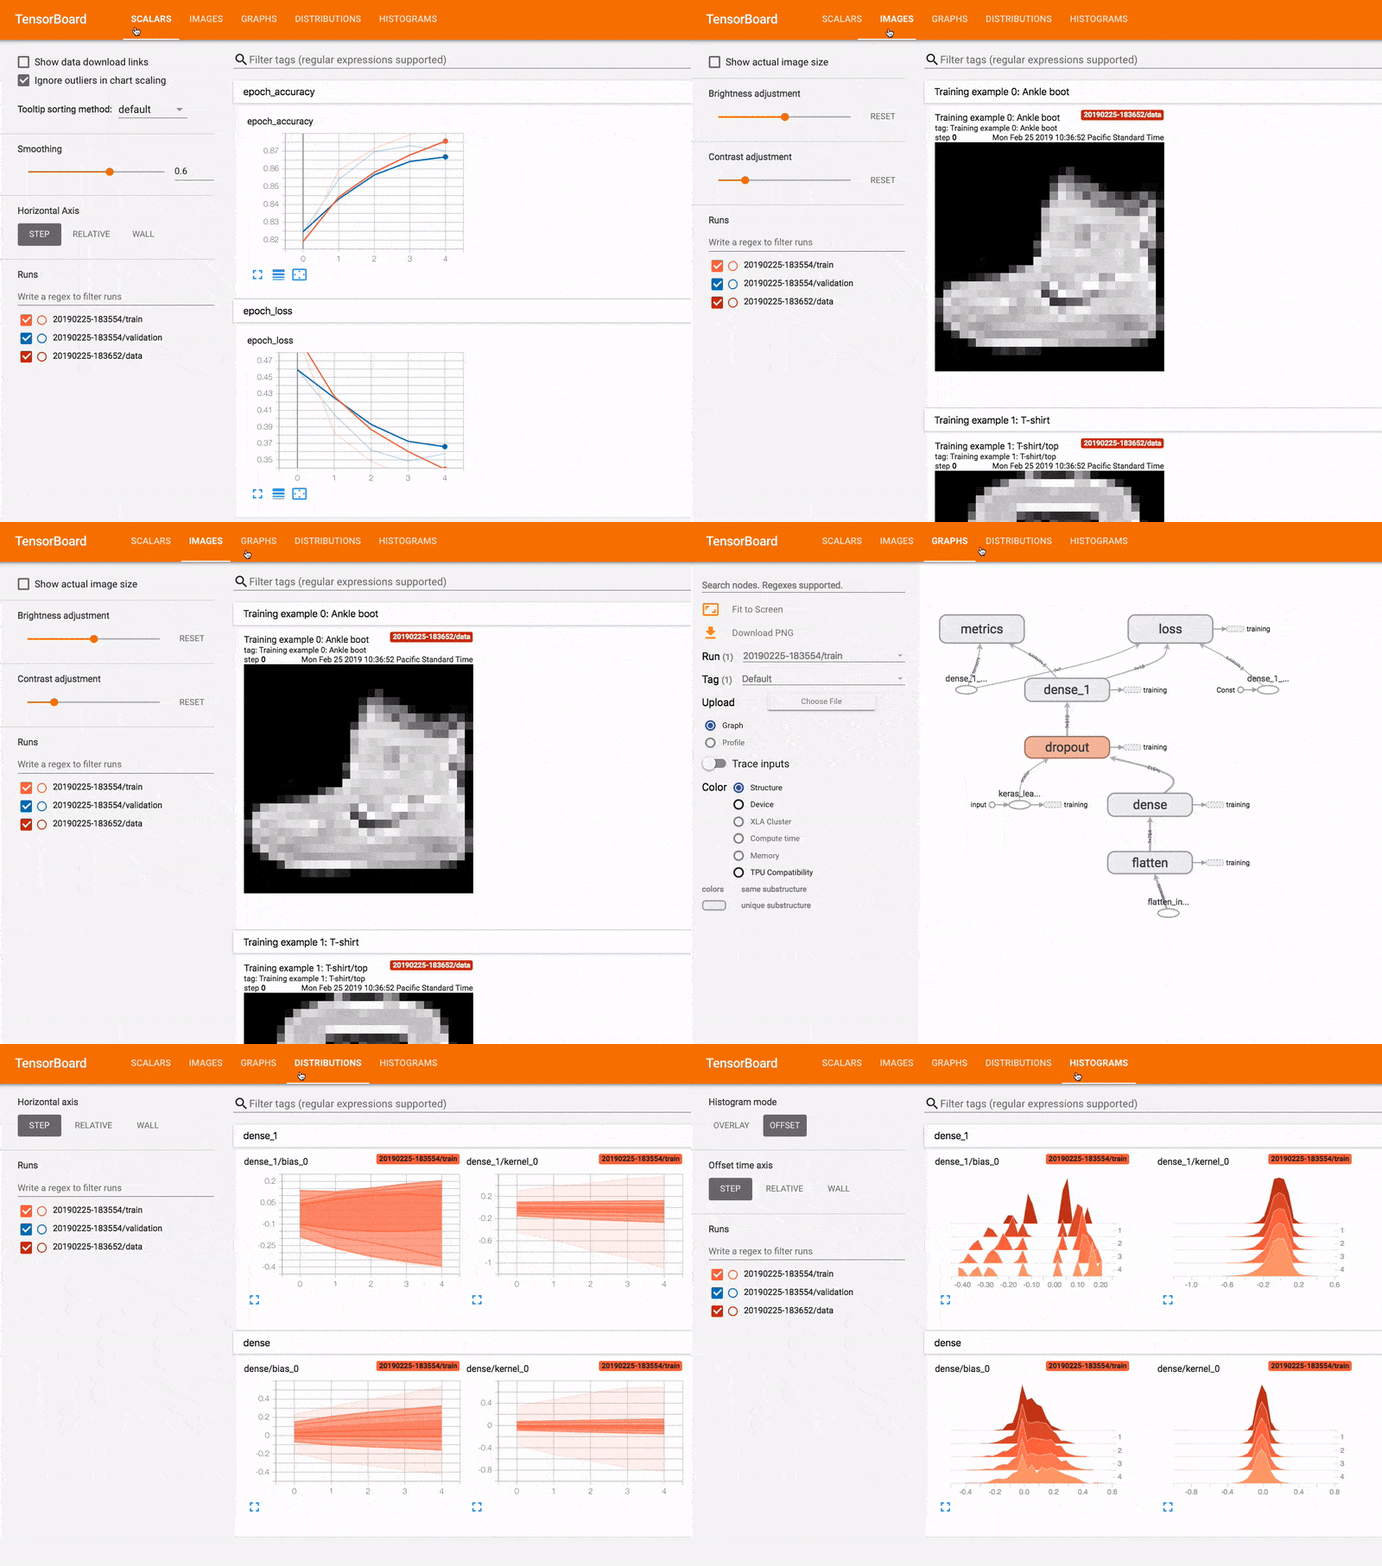
TensorBoard is an interactive visualization toolkit for machine learning experiments. Essentially it is a web-hosted app that lets us understand our model’s training run and graphs.
TensorBoard is not just a graphing tool. There is more to this than meets the eye. Tensorboard allows us to directly compare multiple training results on a single graph. With the help of these features, we can find out the best set of hyperparameters for our model, visualize problems such as gradient vanishing or gradient explosions and do faster debugging.

Getting Started
This article adds functionality to the model we made in the last post. We will see how to integrate TensorBoard logging into our model made in Pytorch Lightning.
Note that we are still working on a Google Colab Notebook
There are two ways to generate beautiful and powerful TensorBoard plots in PyTorch Lightning
- Using the default TensorBoard logging paradigm (A bit restricted)
- Using
loggersprovided by PyTorch Lightning (Extra functionalities and features)
Let’s see both one by one.
Default TensorBoard Logging
Logging per batch
Lightning gives us the provision to return logs after every forward pass of a batch, which allows TensorBoard to automatically make plots.
We can log data per batch from the functions training_step(),validation_step() and test_step().
We return a batch_dictionary python dictionary. It is necessary that the output dictionary contains the loss key. This is the bare minimum requirement to be met by us by Lightning for the code to run.
#defining the model
class smallAndSmartModel(pl.LightningModule):
    '''
    other necessary functions already written
    '''
    def training_step(self,batch,batch_idx):
        # REQUIRED- run at every batch of training data
        # extracting input and output from the batch
        x,labels=batch

        # forward pass on a batch
        pred=self.forward(x)

        # identifying number of correct predections in a given batch
        correct=pred.argmax(dim=1).eq(labels).sum().item()

        # identifying total number of labels in a given batch
        total=len(labels)

        # calculating the loss
        train_loss = F.cross_entropy(pred, labels)

        # logs- a dictionary
        logs={"train_loss": train_loss}

        batch_dictionary={
            #REQUIRED: It ie required for us to return "loss"
            "loss": train_loss,

            #optional for batch logging purposes
            "log": logs,

            # info to be used at epoch end
            "correct": correct,
            "total": total
        }

        return batch_dictionary
In order to allow TensorBoard to log our data, we need to provide the logs key in the output dictionary. The logs should contain a dictionary made up of keys and corresponding values. These keys are then plotted on the TensorBoard.
If you aren’t aware of Python dictionaries, please give this a look.
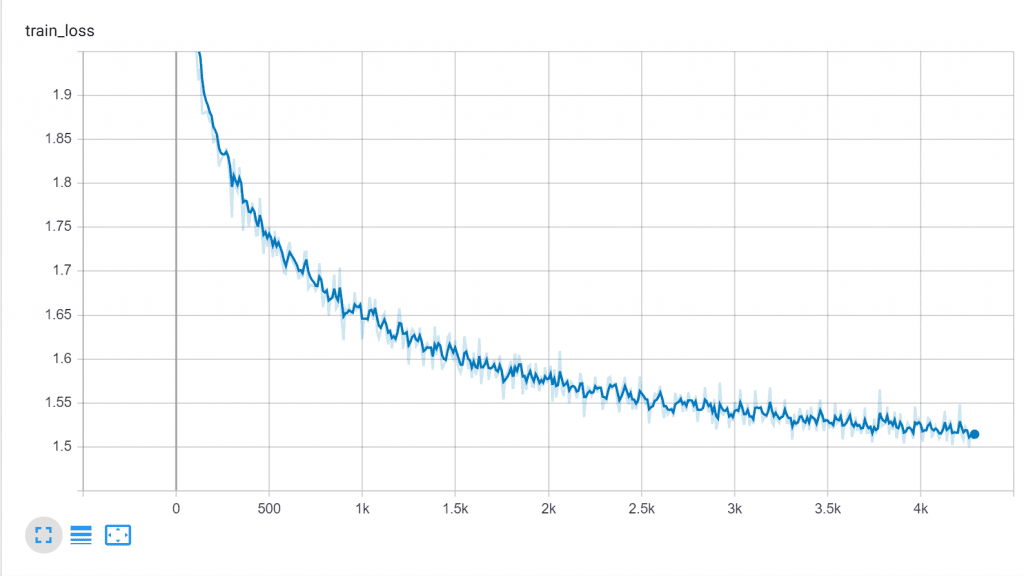
Given below is a plot of training loss against the number of batches
Logging per epoch
We can also log data per epoch. For example, total loss, total accuracy, average loss are some metrics that we can plot per epoch.
#defining the model
class smallAndSmartModel(pl.LightningModule):
    '''
    other necessary functions already written
    '''
     def training_epoch_end(self,outputs):
        #  the function is called after every epoch is completed

        # calculating average loss
        avg_loss = torch.stack([x['loss'] for x in outputs]).mean()

        # calculating correect and total predictions
        correct=sum([x["correct"] for  x in outputs])
        total=sum([x["total"] for  x in outputs])

        # creating log dictionary
        tensorboard_logs = {'loss': avg_loss,"Accuracy": correct/total}

        epoch_dictionary={
            # required
            'loss': avg_loss,

            # for logging purposes
            'log': tensorboard_logs}

        return epoch_dictionary
The most interesting question is: What is outputs ?outputs is a python list containing the batch_dictionary from each batch for the given epoch stacked up against each other. That’s why we are summing up all the correct predictions in output to get the total number of correct predictions for the whole training dataset.
Given below is the plot of average loss produced by TensorBoard.

Viewing data using TensorBoard
The default location for save location for Tensorboard files is lightning_logs/
Run the following on Google Collab notebook after training to open TensorBoard.

The downside of using default TensorBoard Logging
You must have noticed something weird by now. Consider the following plot generated for accuracy.
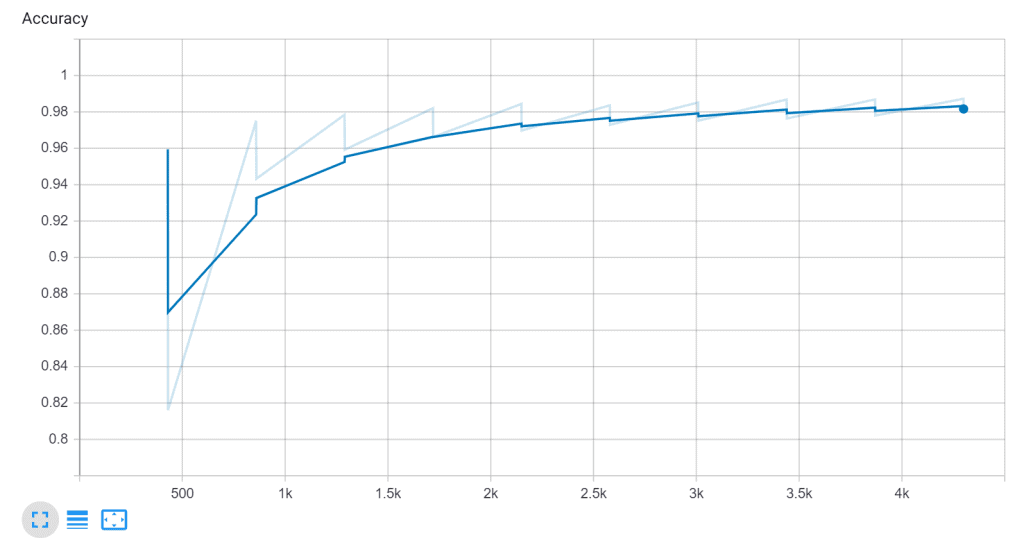
What is the accuracy plotted against? What are the values on the x-axis?
It turns out that by default PyTorch Lightning plots all metrics against the number of batches. Although it captures the trends, it would be more helpful if we could log metrics such as accuracy with respective epochs.
One thing we can do is plot the data after every N batches. This can be done by setting log_save_interval to N while defining the trainer

Another setback of using default Lightning logging is that we aren’t able to exploit advanced features of TensorBoard such as histogram plotting, computational graphs, etc.
To overcome such difficulties we are now going to look at Lightning Loggers.
Logging using Lightning Loggers
Loggers are a utility toolbox that helps in recording data and generating meaningful visual that allows us to better understand the data
Lightning provides us with multiple loggers that help us in saving the data on the disk and generating visualizations. Some of them are
- Comet Logger
- Neptune Logger
- TensorBoard Logger
We will be working with the TensorBoard Logger.
To use a logger we simply have to pass a logger object as an argument in the Trainer.
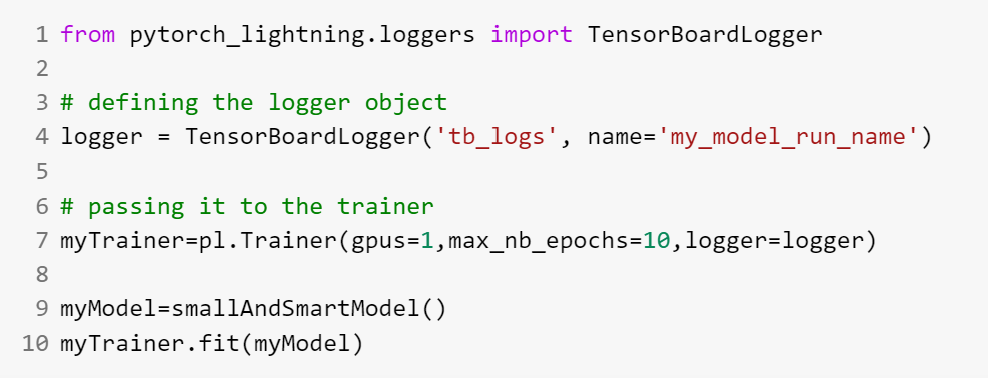
Now tb_logs is the name of the saving directory and this logging will have the name as my_model_run_name
To start TensorBoard use the following command (because the save location has been changed)

While working with loggers, we will make use of logger.experiment (which returns a SummaryWriter object) and log our data accordingly.
For the API of SummaryWriter refer to PyTorch summarywriter.
1. Logging Scalars
We will be calling the logger.experiments.add_scalar() method to log scalar metrics such as loss, accuracy, etc. Now we have the flexibility to log our metrics against the number of epochs.
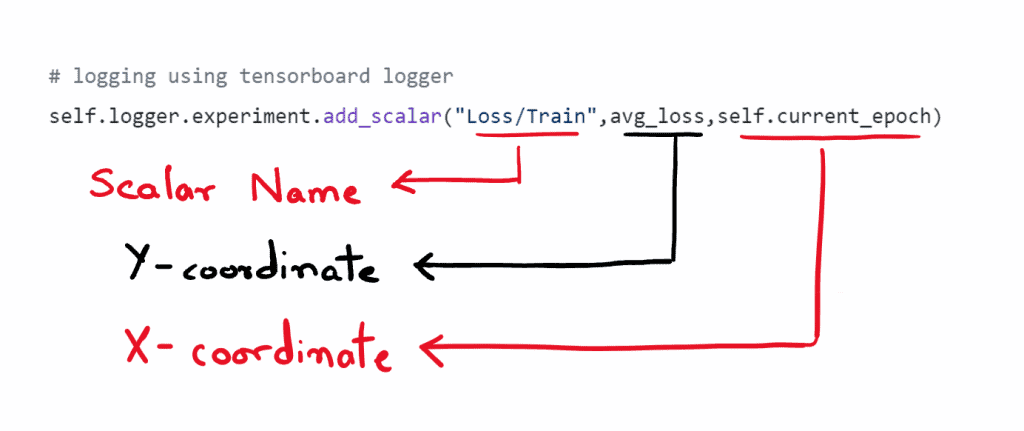
An interesting thing to note is that now we can select our own X-coordinate and hence we can plot the metrics against epochs rather than plotting the metrics against the number of batches
See the code below to understand how we do that.
#defining the model
class smallAndSmartModel(pl.LightningModule):
    '''
    other necessary functions already written
    '''
     def training_epoch_end(self,outputs):
        #  the function is called after every epoch is completed

        # calculating average loss
        avg_loss = torch.stack([x['loss'] for x in outputs]).mean()

        # calculating correect and total predictions
        correct=sum([x["correct"] for  x in outputs])
        total=sum([x["total"] for  x in outputs])

        # logging using tensorboard logger
        self.logger.experiment.add_scalar("Loss/Train",
                                            avg_loss,
                                            self.current_epoch)

        self.logger.experiment.add_scalar("Accuracy/Train",
                                            correct/total,
                                            self.current_epoch)

        epoch_dictionary={
            # required
            'loss': avg_loss}

        return epoch_dictionary
Here is how it looks like.

2. Computational graph
To write the computational graph we will be using add_graph() method. add_graph requires two arguments
- The model
- A sample image for the same shape as that of the input to track how it changes as it passes through the network
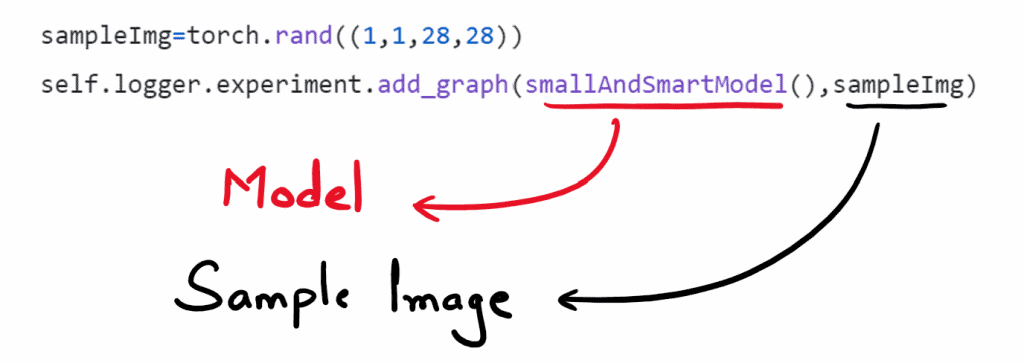
Since we need the computation graph only once, we will add it during the first epoch only
#defining the model
class smallAndSmartModel(pl.LightningModule):
    '''
    other necessary functions already written
    '''
     def training_epoch_end(self,outputs):
        #  the function is called after every epoch is completed
        if(self.current_epoch==1):

            sampleImg=torch.rand((1,1,28,28))
            self.logger.experiment.add_graph(smallAndSmartModel(),sampleImg)


        # calculating average loss
        avg_loss = torch.stack([x['loss'] for x in outputs]).mean()

        # calculating correect and total predictions
        correct=sum([x["correct"] for  x in outputs])
        total=sum([x["total"] for  x in outputs])

        # creating log dictionary
        tensorboard_logs = {'loss': avg_loss,"Accuracy": correct/total}

        epoch_dictionary={
            # required
            'loss': avg_loss,

            # for logging purposes
            'log': tensorboard_logs}

        return epoch_dictionary
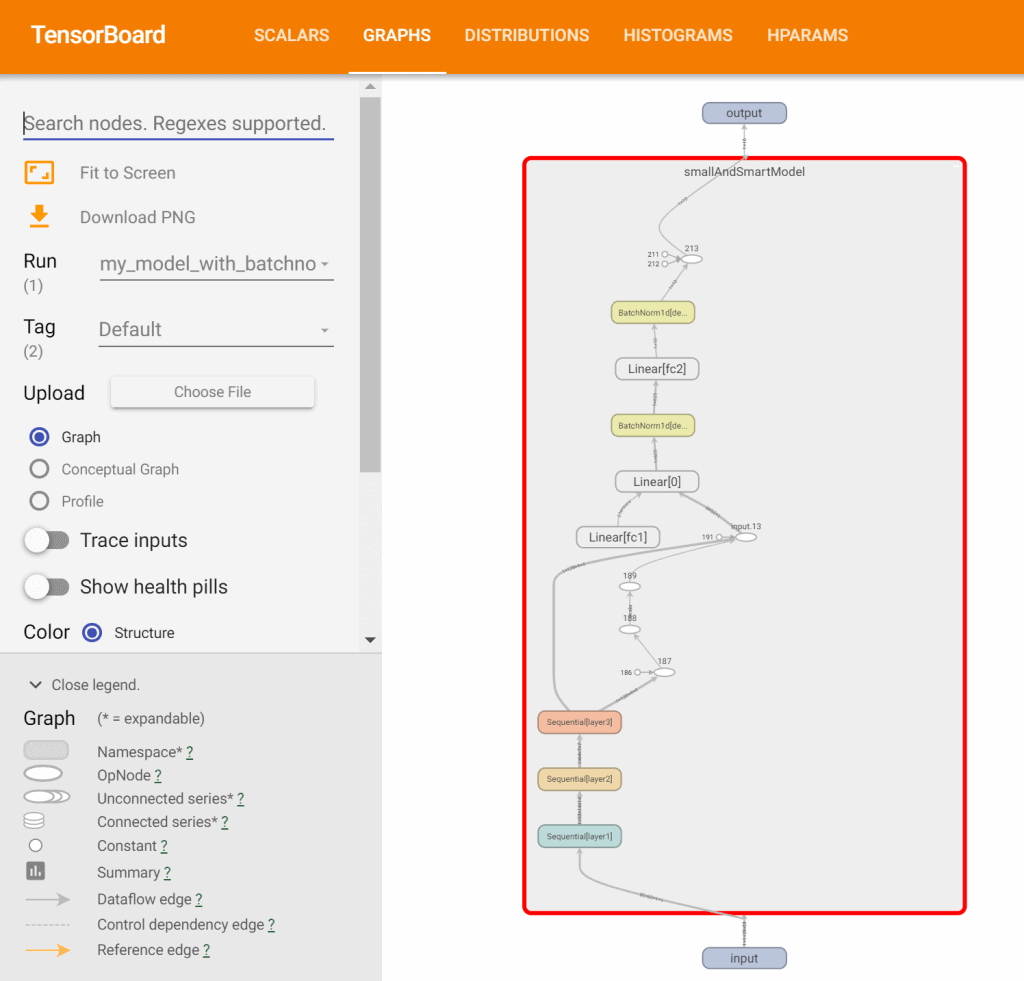
Here is how it looks in TensorBoard
3. Adding Histograms
Histograms are made for weights and bias matrices in the network. They tell us about the distribution of weights and biases among themselves.
In laymen terms, a typical histogram is just a frequency counter of the weights. The horizontal axis depicts the possible values of weights, the height represents the frequency and the depth represents the epoch.
Here is an example
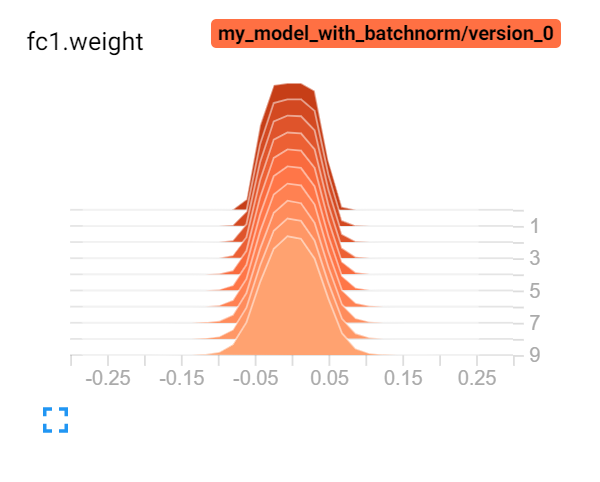
Here most of the weights are distributed between -0.1 to 0.1.
To add histograms to Tensorboard, we are writing a helper function custom_histogram_adder(). We will call this function after every training epoch ( inside training_epoch_end() ).
Keep in mind that creating histograms is a resource-intensive task. If our model has a low speed of training, it might be because of histogram logging.
Histograms are added using add_histogram()

#defining the model
class smallAndSmartModel(pl.LightningModule):
    '''
    other necessary functions already written
    '''
     def custom_histogram_adder(self):

        # iterating through all parameters
        for name,params in self.named_parameters():

            self.logger.experiment.add_histogram(name,params,self.current_epoch)


     def training_epoch_end(self,outputs):
        #  the function is called after every epoch is completed

        # calculating average loss
        avg_loss = torch.stack([x['loss'] for x in outputs]).mean()

        # logging histograms
        custom_histogram_adder()

        epoch_dictionary={
            # required
            'loss': avg_loss}

        return epoch_dictionary
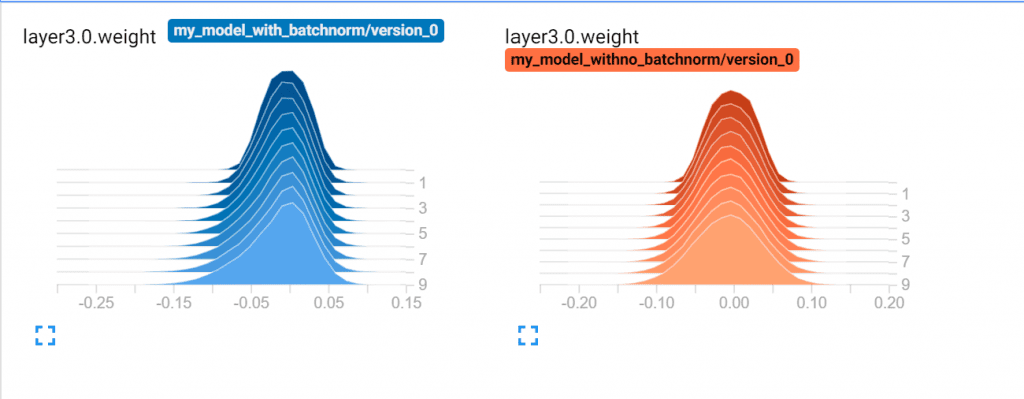
Now given below is a comparison of how the weights are distributed with and without batch normalization. And this is the power of TensorBoard. It allows us to do direct comparisons between two or more trained models
4. Adding Images
In this section we will understand how to add images to TensorBoard. We will be using logger.experiment.add_image() to plot the images.
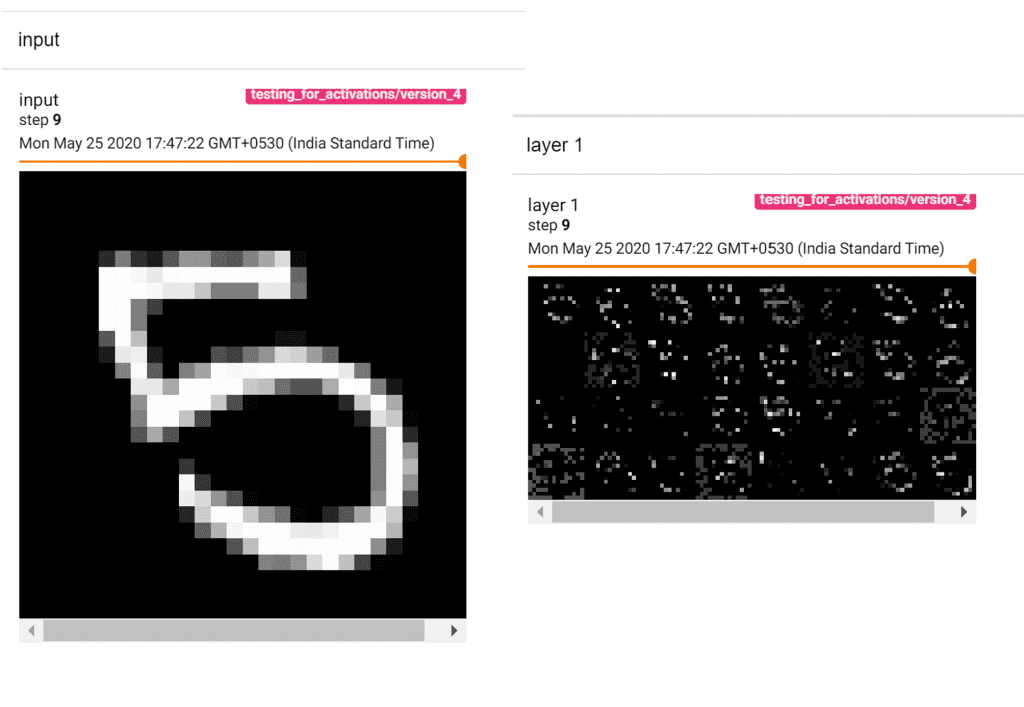
We usually plot intermediate activations of a CNN using this feature. This helps in visualizing the features extracted by the feature maps in CNN.
For a training run, we will have a reference_image. This reference_image is a sample image from the dataset and we will be viewing the activations of the layers of our network as it flows through them. The visualizations are done as each epoch ends.
#defining the model
class smallAndSmartModel(pl.LightningModule):
    '''
    other necessary functions already written
    '''
    def makegrid(output,numrows):
        outer=(torch.Tensor.cpu(output).detach())
        plt.figure(figsize=(20,5))
        b=np.array([]).reshape(0,outer.shape[2])
        c=np.array([]).reshape(numrows*outer.shape[2],0)
        i=0
        j=0
        while(i < outer.shape[1]):
            img=outer[0][i]
            b=np.concatenate((img,b),axis=0)
            j+=1
            if(j==numrows):
                c=np.concatenate((c,b),axis=1)
                b=np.array([]).reshape(0,outer.shape[2])
                j=0

            i+=1
        return c

    def showActivations(self,x):
            # logging reference image
            self.logger.experiment.add_image("input",torch.Tensor.cpu(x[0][0]),self.current_epoch,dataformats="HW")

            # logging layer 1 activations
            out = self.layer1(x)
            c=self.makegrid(out,4)
            self.logger.experiment.add_image("layer 1",c,self.current_epoch,dataformats="HW")

            # logging layer 1 activations
            out = self.layer2(out)
            c=self.makegrid(out,8)
            self.logger.experiment.add_image("layer 2",c,self.current_epoch,dataformats="HW")

            # logging layer 1 activations
            out = self.layer3(out)
            c=self.makegrid(out,8)
            self.logger.experiment.add_image("layer 3",c,self.current_epoch,dataformats="HW")

    def training_epoch_end(self,outputs):
        '''
        other necessay code already written
        '''
        self.showActivations(self.reference_image)
makegrid() makes a grid of images and return the same. showActivations is called after every epoch to add images to TensorBoard.
TensorBoard provides a sleek slider GUI that lets you navigate across epochs for the activation images.
Further, if you want to explore TensorBoard Projector visualization, read the article, t-SNE: T-Distributed Stochastic Neighbor Embedding Explained.
That’s all for today
Now you are ready to integrate your Lightning projects with TensorBoard and utilize its powerful visualization tools.
That’s all from me. If you liked my little introduction to TensorBoard for Lightning do share feedback
Keep learning and have fun!!
References
- https://github.com/PyTorchLightning/pytorch-lightning
- https://pytorch-lightning.readthedocs.io/en/latest/
- https://tensorboardx.readthedocs.io/en/latest/tensorboard.html


